Showing posts with label Blog | Trade Brains. Show all posts

Monday, November 7, 2022

Archean Chemical Industries IPO Review – GMP, Strengths, & More!

Archean Chemical Industries IPO Review: Archean Chemical Industries Limited is coming up with its Initial Public Offering. The IPO will open for subscription on November 9th, 2022, and close on November 11th, 2022.

It is looking to raise Rs 1,462.31 Crores, out of which Rs 805 crores will be a fresh issue and the remaining Rs 657.31 Crores will be an offer for sale. In this article, we will look at the Archean Chemical Industries IPO Review 2022 and analyze its strengths and weaknesses. Keep reading to find out! 

Archean Chemical Industries IPO Review – About The Company

Archean Chemical Industries is a leading specialty marine chemical manufacturer in India that is focused on producing and exporting bromine, industrial salt, and sulfate of potash to customers around the world.

The company has marketed its products to 13 global customers in 13 countries along with 29 domestic customers.

The products of the company are used in industries that include pharmaceuticals, agrochemicals, water treatment, flame retardant, additives, oil & gas, and energy storage batteries.

The product portfolio of the company

Archean Chemical Industries IPO Review - Company

(Source: DRHP of the company)

The competitors of the company

Archean Chemical Industries IPO Review - competitors

(Source: DRHP of the company)

Archean Chemical Industries IPO Review – Financial Highlights

Archean Chemical Industries IPO Review - Financials

(Source: DRHP of the company)

Archean Chemical Industries IPO Review – Industry Overview

Between 2015-2020, the Indian specialty chemicals segment grew faster than the Indian commodity chemicals segment (10.4% vs. 8.7%). In the next five years,  the Indian specialty chemicals segment is expected to grow at a CAGR of 11.2%.

To boost the industry further, the government has allowed 100% Foreign Direct Investment (FDI). According to the Company Commissioned F&S Report, total FDI inflow in the chemicals (other than fertilizers) sector in India reached US$17.77 billion between April 2000 and June 2020.

According to the Company Commissioned F&S Report, with abundant resources, India’s bromine capacity has developed rapidly, from 20,000 MT in the year 2008 to 60,000 MT in the year 2020. 

In the year 2020, India ranked 6th globally in the export of industrial salt. As per the same report, the global industrial salt industry will grow at a CAGR of 2.8% from 157 million MT in 2020 to 185 million MT in 2025.

The overall Sulphate of Potash (SOP) market in India was approximately 55,757 MT in Fiscal 2020. According to the Company Commissioned F&S Report, the growth in SOP in India is expected to follow the global trend of approximately 6% until the year 2025.

Strengths of the Company

  • The company was the largest exporter of bromine and industrial salt in India in Fiscal 2021.
  • The company has a competitive advantage as the industry in which it operates has high entry barriers.
  • The company has made huge capital expenditures to build integrated manufacturing sites that have proven to be cost-effective for the company.
  • The company has an Experienced management team, promoters, financial investors, and stakeholders.
  • The company has a history of strong and consistent financial performance.

Weaknesses of the Company

  • Bromine and certain raw materials used by the company are hazardous in nature. Thus, it has an inherent operational risk.
  • The company is subject to extensive safety, health, environmental, and labor laws.
  • Since the company has an extensive presence in the international markets it is subject to exchange rate fluctuations.
  • The company is dependent on third-party transportation and logistics service providers. Any disruptions can affect the business.
  • The company does not own any patents and its logo is not registered as a trademark. Therefore, protecting intellectual property is crucial to the success of their business.

Archean Chemical Industries IPO Review – GMP

The shares of Archean Chemical Industries traded at a premium of 14.74% in the grey market on November 7th, 2022. The shares tarded at Rs 467. This gives it a premium of Rs 60 per share over the cap price of Rs 407. 

Archean Chemical Industries – Key IPO Information

Archean Chemical Industries IPO Review - Key IPO

Promoters: Chemikas Speciality LLP, Ravi Pendurthi, and Ranjit Pendurthi.

Book Running Lead Managers: JM Financial Limited, ICICI Securities Limited, and IIFL Securities Limited.

Registrar To The Offer: Link Intime India Private Limited

Particulars Details
IPO Size ₹1,462.31 Crore
Fresh Issue ₹805 Crore
Offer for Sale (OFS) ₹657.31 Crore
Opening date November 9, 2022
Closing date November 11, 2022
Face Value ₹2 per share
Price Band ₹386 to ₹407 per share
Lot Size 36 Shares
Minimum Lot Size 1 (36 Shares)
Maximum Lot Size 13 (468 shares)
Listing Date November 21, 2022

The Objective of the Issue

The Net Proceeds from the Fresh Issue are proposed to be utilized for:

  • Redemption or earlier redemption, in part or full, of NCDs issued by the company; and
  • General corporate purposes

In Closing

In this article, we looked at the details of Archean Chemical Industries IPO Review 2022. Analysts remain divided on the IPO and its potential gains. This is a good opportunity for investors to look into the company and analyze its strengths and weaknesses. That’s it for this post.

Are you applying for the IPO? Let us know in the comments below.

You can now get the latest updates in the stock market on Trade Brains News and you can even use our Trade Brains Portal for fundamental analysis of your favorite stocks

The post Archean Chemical Industries IPO Review – GMP, Strengths, & More! appeared first on Trade Brains.

Via

https://ift.tt/y1KTmDC

Sunday, November 6, 2022

Fundamental Analysis of Aegis Logistics – Financials, Future Plans & More

Fundamental Analysis Of Aegis Logistics - Cover Image

Fundamental Analysis of Aegis Logistics: Indian logistics industry is one of the most defragmented sectors with only 10% organized. However, within the broader logistics sector lies a subset with entry barriers, a highly organized nature, requiring multiple safety standards and whatnot.

We are talking about the oil and gas logistics industry in India. Many a time, such niche areas are able to provide attractive opportunities for investors.

In this article, we shall perform a fundamental analysis of Aegis Logistics, a renowned name in India’s energy logistics industry.

Fundamental Analysis of Aegis Logistics

We shall now start our fundamental analysis of Aegis Logistics. covering company overview, business segments, industry overview, financials, future plans, and key metrics. 

So without further ado, let’s begin.

Company Overview

Founded in 1956, Aegis Logistics Ltd. is a leading integrated oil, gas, and chemical logistics company in India. It is one of the top importers and handlers of liquefied petroleum gas (LPG) among private players in the nation. 

It owns and operates a large network of liquid and gas terminals across prominent Indian ports. The company has a capacity of 15,70,000 kilolitres (KL) for chemicals and petroleum, oil & lubricants (POL). Additionally, Mumbai-headquartered Aegis has a static capacity of 1,14,000 MT for LPG.

The company boasts of a strong client base with names such as Reliance Industries, Hindustan Petroleum, ONGC, Bharat Petroleum, Tata Steel, Shell, and more. It employs about 1180 people.

In its essence, the expertise of the Aegis Group lies in the terminalling and handling of liquids and gases. The terminalling fees from the operations are the primary and stable source of income in the business.

Business Segments

Let us now move ahead to understand the business segments of the company as part of our fundamental analysis of Aegis Logistics.

Specifically, the logistics company has two primary reportable segments: Liquid Terminal Division and the Gas Terminal Division. 

In FY22, the liquid logistics segment and gas segment accounted for 33% and 67% of the EBITDA respectively. 

It’s Liquid Terminal Division involves the storage and terminalling facility of oil and chemical products covering third-party gas logistics and operations & maintenance services.

Gas Terminal Division undertakes imports, storage, and distribution of petroleum products viz. LPG, Propane, etc. involving third-party gas logistics, autogas retailing, packed LPG cylinders for the commercial segment, industrial gas distribution, gas sourcing, and marine products distribution.

Having read about the company and its operating segments, let us devote the next section of get an understanding of the industry landscape.

Industry Overview

India is a net importer of almost of types of energy. This fact, along with the growing population, rising income levels, and economic development will increase the nation’s energy demand in the coming years. All this will directly lead to the growth of the energy logistics sector in the country.

India’s LPG demand grew at a CAGR of 7.1% from 7,016,000 metric tonnes (MT) in 2000-01 to 29,032,000 MT in 2021-22 (projected). 

During the same period, a sharp dependency on imports emerged when imports surpassed domestic production of LPG in 2018-19. For instance, imports of 853,000 MT accounted for 12% of the nation’s total LPG consumption in 2000-01. As early as 2020-21, imports fulfilled 57% of the nation’s LPG need.

Thus, we can observe that rising LPG demand and increased dependency on imports bodes for the oil & gas logistics sector.

The terminalling, retail, and distribution industries ask for specialized infrastructures like berths, fire-fighting equipment, pipelines, transit storage, and handling facilities. This points to the strong entry barriers in the industry.

Summing everything up, we can note that Aegis Logistics is well-placed to leverage the growth opportunities that lie ahead as India will be importing more and more clean energy in the form of LPG in the future.

Aegis Logistics – Financials

In this section we look at the key financial metrics of the company: revenue & net-profit growth, debt levels, and return ratios.

Revenue and Net-profit Growth

Fundamental Analysis of Aegis Logistics - Financials

We can see in the chart above that the revenues of Aegis Logistics have been inconsistent over the years. However, during the same period its net profit climbed 80% from Rs. 214 crores in FY18 to Rs. 385 crores in FY22. 

The rise in earnings can be attributed to improving operating margins for the company. The table below presents operating profit margins and net profit margins for the last five years.

Year NPM (%) OPM (%)
2022 8.31 10.66
2021 6.48 9.18
2020 1.86 3.35
2019 4.48 5.84
2018 4.46 5.01

Return Ratios and Debt Figures

Despite being in a capital-intensive industry, Aegis Logistics has a low debt-to-equity ratio of 0.18. It boasts a high-interest coverage ratio also at 26.35 times. 

As for the key return ratios: return on capital employed (RoCE) and return on equity (RoE), they have improved over the years. The table below highlights the strengthening of Aegis’ earnings in the recent financial year.

Year RoCE (%) RoE (%)
2022 17.22 16.40
2021 13.69 11.53
2020 11.16 6.01
2019 20.03 15.91
2018 16.72 16.38

Aegis Logistics – Future Plans

So far we have looked at only past years’ financial statements as part of our study of the fundamental analysis of Aegis Logistics. In this section, we look at what lies ahead for the company and its investors.

  1. Aegis has formed a JV with Royal Vopak N.V., a Dutch independent tank storage company to establish liquids and gas terminalling facilities at Pipavav, Haldia, Mangalore, and Kochi. 
  2. Additionally, it secured sourcing tenders for the 2022 calendar year for approximately 800,000 metric tons.
  3. It has also signed a 10+15 years contract with Shell, a UK oil giant for the usage of 21,000 kiloliters of petroleum storage. This provides the company with robust revenue visibility.
  4. Aegis has planned 65 more gas retailing stations in 20 states in near future from 135 stations in 10 states presently.
  5. In FY22-23 the company shall see higher volumes of LPG handled because of the commissioning of various new projects at its terminals: Kandla, Haldia, Mumbai, and Pipavav.
  6. Furthermore, the expansion of its liquids terminal at Mangalore and Kochi will fetch better volumes in FY23 for the company.

Fundamental Analysis of Aegis Logistics – Key Metrics

We are now almost at the end of our fundamental analysis of Aegis Logistics. Let us take a quick look at the key metrics of the company.

CMP ₹302 Market Cap (Cr.) ₹10,500
EPS ₹11.2 Stock P/E 26.8
ROCE 17.2% ROE 16.4%
Face Value ₹1.0 Book Value ₹62.1
Promoter Holding 58.1% Price to Book Value 4.86
Debt to Equity 0.18 Dividend Yield 0.83%
Net Profit Margin 8.31% Operating Profit Margin 10.66%

In Conclusion

In this article, we performed a fundamental analysis of Aegis Logistics. From what we have studied so far, we can see that the company is trailing behind in terms of revenues though it has improved on the profitability front.

Going forward, investors will have to track the business closely to make sure it continues improvement in its on profit margins front. Similarly, a growth in revenues shall also be on investors’ minds. 

Do you think Aegis Logistics will be able to match its past revenue levels along with improved margins? In your opinion, what shall be the other key metrics investors should track about the business? How about you let us know in the comments below?

You can now get the latest updates in the stock market on Trade Brains News and you can even use our Trade Brains Portal for fundamental analysis of your favorite stocks.

The post Fundamental Analysis of Aegis Logistics – Financials, Future Plans & More appeared first on Trade Brains.

Via

https://ift.tt/gn0Urdp

Thursday, November 3, 2022

Global Health IPO Review – GMP, Strengths, Weaknesses & More!

Global Health IPO Review - Cover Image

Global Health IPO Review: Global Health Limited is coming up with its Initial Public Offering. The IPO will open for subscription on November 3rd, 2022, and close on November 7th, 2022. It is looking to raise Rs 2,205.57 Crores, out of which Rs 500 crores will be a fresh issue and the remaining Rs 1,705.57 Crores will be an offer for sale.

In this article, we will look at the Global Health IPO Review 2022 and analyze its strengths and weaknesses. Keep reading to find out!

Global Health IPO Review – About The Company

Global Health Limited opened its first hospital in Gurugram in the year 2009. Currently, it is one of the largest private multi-specialty tertiary care providers operating in the North and East regions of India in terms of bed capacity and operating revenues as of March 2022.

The company operates under the brand “Medanta” which specializes in cardiology and cardiac science, neurosciences, oncology, digestive and hepatobiliary sciences, orthopedics, liver transplant, and kidney and urology.

Global Health Limited IPO Review - Assets

As of June 30, 2022, the company provides healthcare services in over 30 medical specialties and engages over 1,300 doctors led by experienced department heads, spanning an area of 4.7 million sq. ft., our operational hospitals have 2,467 installed beds.

In addition to that, the company also operates six multispeciality clinics at DLF Cybercity Gurugram, Delhi Airport, south Delhi, Darbhanga, Patna, and Subhash Chowk Gurugram.

The key focus areas of the company

  • The Medanta Heart Institute
  • The Medanta Institute of Neurosciences 
  • The Cancer Institute
  • The Institute of Digestive and Hepatobiliary Sciences
  • Medanta Institute of Kidney and Urology
  • Institute of Musculoskeletal Disorders and Orthopaedics
  • The Medanta Institute of Liver Transplantation and Regenerative Medicine
  •  Internal Medicine Division at Medanta

The competitors of the company

Global Health Limited IPO Review - Competitors

(Source: DRHP of the company)

Global Health IPO Review – Financial Highlights

Global Health Limited IPO Review - Financials

(Source: DRHP of the company)

Global Health IPO Review – Industry Overview

The healthcare budget has increased year-over-year, with a budget for the Ministry of Health and Family Welfare(MoHFW) clocking an 11% CAGR between fiscal 2011 and fiscal 2023. 

In addition to that, the government of India has taken additional measures to improve the healthcare segment. An open platform for National Digital Health Ecosystem to be rolled out. 

Government expenditure on healthcare has remained range bound at 20-30% of the current healthcare expenditure from 2010 to 2016. However, moving forward,  the Government aims to increase public healthcare expenditure to 2.5%- 3.0% of GDP by 2025 from the current 2%, according to the National Health Policy. 

Further, CRISIL Research estimates the Indian healthcare delivery market to reach approximately Rs 5.5 – 5.7 trillion in value, terms by end of fiscal 2023, with growth being contributed by stabilization of regular treatments, surgeries, and OPD, amid minimization of disruption due to the pandemic and expansion of Average revenue per occupied bed (“ARPOB”) for the sector.

Strengths

  • The company is a Tertiary and quaternary care provider in India, that is recognized for its clinical expertise in particular in dealing with complicated cases.
  • The company has established multiple institutions to focus on Clinical Research and Academics.
  • The company has large-scale hospital chains with sophisticated infrastructure, medical equipment, and technology.
  • The company has focused on under-served areas with dense populations and is also looking to diversify into new service areas such as digital health
  • The company is a ‘Doctor-led’ hospital that is driven by skilled and experienced doctors in the healthcare space.

Weaknesses

  • The company is heavily dependent on a few hospitals that generate a significant portion of its revenue. Any changes in that will lead to a decline.
  • The business is highly dependent on the availability of medical professionals. Any changes in the retention rate might affect the business.
  • The company is subject to incurring heavy costs such as manpower cost, infrastructure maintenance & repair cost, and high medical equipment cost. The inability to recover these costs can lead to a decline in profits.
  • The company is subject to stringent laws and regulations and is expected to meet healthcare quality standards. Nonadherence to them can affect the reputation of the business.
  • The company has certain outstanding litigation against them, their directors, Subsidiaries, and Promoter.

Global Health IPO Review – GMP

The shares of Global Health traded at a premium of 4.46% in the grey market on November 3rd, 2022. The shares tarded at Rs 351. This gives it a premium of Rs 15 per share over the cap price of Rs 336. 

Global Health IPO Review – Key IPO Information

Promoters: Dr. Naresh Trehan

Book Running Lead Managers: Credit Suisse Securities (India) Private Limited, Jefferies India Private Limited, JM Financial Limited, and Kotak Mahindra Capital Company Limited.

Registrar To The Offer: KFin Technologies Limited

Particulars Details
IPO Size ₹2,205.57 Crore
Fresh Issue ₹500 Crore
Offer for Sale (OFS) ₹1,705.57 Crore
Opening date November 3, 2022
Closing date November 7, 2022
Face Value ₹2 per share
Price Band ₹319 to ₹336 per share
Lot Size 44 Shares
Minimum Lot Size 1 (44 Shares)
Maximum Lot Size 13 (572 Shares)
Listing Date November 16, 2022

The Objective of the Issue

The Net Proceeds from the Fresh Issue are proposed to be utilized for:

  • Investment in two of their Subsidiaries, GHPPL and MHPL, in the form of debt or equity for repayment/prepayment of borrowings, in full or part, of such Subsidiaries.
  • General corporate purposes

In Closing

In this article, we looked at the details of Global Health Limited IPO Review 2022. Analysts remain divided on the IPO and its potential gains. This is a good opportunity for investors to look into the company and analyze its strengths and weaknesses. That’s it for this post.

Are you applying for the IPO? Let us know in the comments below.

You can now get the latest updates in the stock market on Trade Brains News and you can even use our Trade Brains Portal for fundamental analysis of your favourite stocks.

The post Global Health IPO Review – GMP, Strengths, Weaknesses & More! appeared first on Trade Brains.

Via

https://ift.tt/EUACzni

Wednesday, November 2, 2022

Bikaji Foods IPO Review – GMP, Strengths, Weaknesses & More!

Bikaji Foods International Limited is coming up with its Initial Public Offering. The IPO will open for subscription on November 3rd, 2022, and close on November 7th, 2022. It is looking to raise Rs 881.22 Crores, which will be an offer for sale.
In this article, we will look at the Bikaji Foods IPO Review and analyze its strengths and weaknesses. Keep reading to find out!

Bikaji Foods IPO Review – About The Company

Mr. Shiv Ratan Agarwal launched the Bikaji brand in the year 1993 with an in-depth understanding of Indian tastes and preferences. 

Today the company is one of India’s largest fast-moving consumer goods (“FMCG”) brands with an international footprint. It is engaged in selling Indian snacks and sweets and is among the fastest-growing companies in the Indian organized snacks market.

The company stood as the second largest manufacturer of handmade papad with an annual production capacity of 9,000 tonnes in Fiscal 2021.

The company serves the sweet tooth by being one of the largest manufacturers of packaged rasgulla with an annual capacity of 24,000 tonnes and one of the largest manufacturers of soan papdi and gulab jamun with an annual capacity of 23,040 tonnes and 12,000 tonnes respectively. 

The company has a large pan-India distribution network. As of September 30, 2021, they had five depots, 43 super stockists, and 438 direct and 1,644 indirect distributors that work with their super stockists, located across 22 states and three union territories in India.

The Product portfolio of the company

Their products range from bhujia, namkeen, packaged sweets, papad, and western snacks as well as other snacks which primarily include gift packs (assortment), frozen food, mathri range, and cookies.

Bikaji Foods International IPO Review - Product Portfolio

(Source: DRHP of the company)

The competitors of the company

Bikaji Foods International IPO Review - Compititors

(Source: DRHP of the company)

Bikaji Foods IPO Review – Financial Highlights

Bikaji Foods International IPO Review - Financials

(Source: DRHP of the company)

Bikaji Foods IPO Review – Industry Overview

India’s packaged food business is currently valued at ₹ 3,615 billion. It has grown significantly in the last five years on account of changing lifestyles, rising incomes, and urbanization.  It is estimated to grow at a CAGR of 11.50% in the next five years to reach ₹ 5,581 billion.

Indian Savoury Snacks market is valued at ₹ 728 billion in 2021 and is expected to reach ₹ 1,186 billion by 2025 at a CAGR of 13%.

Sweets have been a very traditional and popular cultural aspect in Indian households. The Indian sweet market is valued at ₹ 589 Billion with a major share coming from unorganized players. The market is predicted to reach ₹ 843 billion by 2025.

The Papad market in India is expected to reach ₹ 99 billion by 2025 with a CAGR of 7.58%. The organized market in the papad segment is valued at ₹ 23 billion and is growing at a CAGR of 10%.

Strengths of the Company

  • The company has a well-established brand name along with a strong pan-India presence.
  • The company has a diversified product portfolio that includes more than 250 products across all our product segments.
  • The company has Strategically located, large scale sophisticated manufacturing facilities with stringent quality standards.
  • The company has made an extensive distribution network in India over the years and has also established strategic arrangements with retail chains in domestic and international markets.
  • The company is led by experienced promoters and a management team.

Weaknesses of the Company

  • The revenue of the company is significantly dependent on the sale of its Bhujia products. Any changes can impact their business. 
  • The production of the company is heavily dependent on timely manufacturing. Any changes can disrupt the supply chain.
  • The company is also dependent on its external distribution network. Any disputes with these parties can hinder their supply chain.
  • The company requires raw materials for production. Any changes in the procurement or prices of raw materials can affect the business.
  • The company is subject to stringent regulations under the Food Safety and Standards Act, 2006 (“FSS Act”). 

Bikaji Foods IPO Review – GMP

The shares of Bikaji Foods International traded at a premium of 23.67% in the grey market on November 2nd, 2022. The shares tarded at Rs 371. This gives it a premium of Rs 71 per share over the cap price of Rs 300. 

Bikaji Foods IPO Review – Key IPO Information

Key IPO Information

Promoters: Shiv Ratan Agarwal, Deepak Agarwal, Shiv Ratan Agarwal (HUF), and Deepak Agarwal (HUF)

Book Running Lead Managers: JM Financial Limited, Axis Capital Limited, IIFL Securities Limited, Intensive Fiscal Services Private Limited, and  Kotak Mahindra Capital Company Limited.

Registrar To The Offer: Link Intime India Private Limited

Particulars Details
IPO Size ₹881.22 Crore
Fresh Issue -
Offer for Sale (OFS) ₹881.22 Crore
Opening date November 3, 2022
Closing date November 7, 2022
Face Value ₹1 per share
Price Band ₹285 to ₹300 per share
Lot Size 50 Shares
Minimum Lot Size 1 (50 Shares)
Maximum Lot Size 13 (650 Shares)
Listing Date November 16, 2022

The Objective of the Issue

The Net Proceeds from the Fresh Issue are proposed to be utilized for:

  • Achieve the benefits of listing the Equity Shares on the Stock Exchanges;
  • Carry out the Offer for Sale of up to 29,373,984 Equity Shares by the Selling Shareholders. 

In Closing

In this article, we looked at the details of Bikaji Foods IPO Review 2022. Analysts remain divided on the IPO and its potential gains. This is a good opportunity for investors to look into the company and analyze its strengths and weaknesses. That’s it for this post.

Are you applying for the IPO? Let us know in the comments below.

You can now get the latest updates in the stock market on Trade Brains News and you can even use our Trade Brains Portal for fundamental analysis of your favorite stocks.

The post Bikaji Foods IPO Review – GMP, Strengths, Weaknesses & More! appeared first on Trade Brains.

Via

https://ift.tt/rp2Q1NB

Tuesday, November 1, 2022

Fundamental Analysis of Ambuja Cements – Overview, Future Plans & More

Fundamental Analysis Of Ambuja Cements - Cover Image

Fundamental Analysis of Ambuja Cements: Recently Gautam Adani made news again by becoming India’s second-largest cement producer in a snap. The Adani Family acquired the assets of Holcim India, Ambuja Cements, and ACC for $ 6.4 billion.

This begets a question, “What did the Adani Family see in Ambuja Cements and ACC?” Let us try to get to the answer by conducting fundamental analysis of Ambuja Cements.

We shall start with getting a quick overview of the company. After that, we move to understand India’s cement industry landscape. Next, we look at how the company has grown over the years, its return ratios, and its profit margins. Future plans and a summary conclude the article in the end.

Without further ado, let us just in. 

Ambuja Cements – Company Overview

Established in 1983, Ambuja Cements is one of the leading cement producers in India. It owns 6 integrated manufacturing units, 8 grinding units, 5 captive power plants, and 5 bulk cement terminals. This gives the Mumbai-based company a cumulative manufacturing capacity of 31.45 MTPA. 

The company has a diversified presence across most of the country: northern, western, central, and eastern markets. Ambuja has a monopolistic market share of 89% in the blended cement category. 

The figure below highlights the diversified manufacturing as well as sales capabilities of Ambuja Cements Ltd.

Fundamental Analysis Of Ambuja Cements - Company

In 2006, Switzerland-headquartered The Holcim Group entered into a partnership with Ambuja Cements. Over time, it acquired a majority stake of 63% in the company. In another move in 2016, Ambuja bought Holcim’s stake in ACC which the Swiss major had started acquiring in 2004. This made Ambuja a majority shareholder in ACC Ltd with a stake of 54.53%.

However, as recently as May this year, the company saw an ownership change. The power to ports conglomerate Adani Group acquired Holcim’s Indian interests in Ambuja and consequently in ACC. 

Having known about the company, let us now move ahead to get an overview of the cement industry in India as part of our fundamental analysis of Ambuja Cements Ltd.

Industry Overview

India’s cement industry is the second largest in the world after China. It accounts for 8% of the global cement market with an estimated manufacturing capacity of 550 MTPA. However, at 242 kg, the nation’s per capita cement consumption is less than half of the world average of 525 kg. This offers a huge growth headroom for Indian cement producers.

The cement demand in India grew 13% year on year (y-o-y) in the calendar year 2021. It is projected to increase by 7% y-o-y in 2022. The cement sector growth closely follows the GDP growth of the country making it a cyclical industry.

Going forward, structural demand from the housing sector, increasing rural incomes, National Infrastructure Pipeline expenditure, and industrial/commercial demand will be primary growth drivers for the sector.

The industry is heavily dependent on power, fuel, and transportation costs. For instance, together power & fuel costs and freight & forwarding expenses accounted for almost 60% of the cost for Ambuja Cements in FY21.

This makes the cement industry a geographical play because of the heavy transportation costs that go into the movement of raw materials and finished cement.  

Thus we can conclude that the Indian cement industry is a slow-growing sector with huge growth potential. We can now move ahead to know how Ambuja Cements has grown over the last five years.

Ambuja Cements – Financials

Revenue & Net-Profit Growth

As previously mentioned, Ambuja Cements holds a 50.05% stake in ACC Ltd making it a subsidiary of the former. For the FY21 ended December, ACC reported sales of ₹ 16,152 crores. Ambuja Cements’ standalone operations generated revenues of ₹ 13,965 crores.

This prompts us to study consolidated as well as standalone revenues and net-profit figures of the company as part of our fundamental analysis of Ambuja Cements.

Over the previous 5 years, the consolidated revenues of Ambuja Cements have grown at a CAGR of 4.17% every year. During the same period, the standalone revenues saw an annual growth rate of 5.96% every year.

As for its net profits, they grew at a rate of 13.79% and 10.73% for the last 5 years on a consolidated and standalone basis respectively.

The table below presents the revenue and net profit figures of Ambuja Cements on a consolidated and standalone basis for the last five years.

Consolidated (in Rs. Cr.) Standalone (in Rs. Cr.)
Year Revenue Net Profit Revenue Net Profit
2021 28,965 3,711 13,965 2,081
2020 24,516 3,107 11,372 1,790
2019 27,104 2,783 11,668 1,529
2018 26,041 2,973 11,357 1,487
2017 23,609 1,945 10,457 1,250
5-Yr CAGR 4.17% 13.79% 5.96% 10.73%

Profit Margins

So far we have covered the company description, industry overview, and growth of the company as part of our fundamental analysis of Ambuja Cements Ltd. In this section, we talk about the profit margins of the cement manufacturer.

On the back of better capacity utilisations, the operating and net profit margins of Ambuja Cements have increased over the years. The table below shows profit margins for the last five years.

Year NPM (%) OPM (%)
2021 13 19
2020 13 18
2019 10 15
2018 11 12
2017 8 13

Debt & Return Ratios

Ambuja Cements is almost a debt-free company with a very low debt of Rs. 47 crores and a negligible debt-to-equity ratio of 0.02. 

As for the consolidated return ratios of Ambuja Cements, we can see in the table below that they have improved sharply over the last five financial years. In FY21, the return on equity and the return on capital employed was impressive levels of 10.96% and 15.92% respectively.

Year RoE (%) RoCE (%)
2021 10.96 15.92
2020 10.39 14.09
2019 8.7 12.93
2018 9.73 11.15
2017 7.33 11.11

Shareholding Pattern & Pledged Shares

Presently, the Adani Group owns 63.22% stake in Ambuja Cements through Holderind Investments Ltd and Endeavour Trade And Investment Ltd. To fund his gigantic purchase of the cement companies, the group pledged its entire stake in Ambuja Cements and ACC. immediately after the acquisition.

As per separate filings with the exchanges, the group stated that about 57% of ACC and 63% of Ambuja Cements have been encumbered “for the benefit of certain lenders and other finance parties”.

Additionally, FIIs and DIIs own an 11.05% and a 26.26% stake in the company respectively.

Future Plans Of Ambuja Cements

  1. In FY21, the company spent Rs. 1,160 crores toward capex out of which Rs. 310 crores will be earmarked for brownfield expansion of 1.5 MTPA at its Ropar unit.
  2. Additionally, it expanded clinker capacity by 3.2 MTPA (brownfield) and cement grinding capacity by 7 MTPA.
  3. Ambuja Cements has also secured limestone reserves to support its long-term growth plans.
  4. The cement manufacturer has audacious goals of achieving 50 MTPA production capacity in the near future, an growth of 59% from present levels.
  5. As for the long-term goals of both companies, Gautam Adani has announced a long-term target of 140 MPTA by 2030. This points to doubling production capacity from 70 MTPA at present. 

Fundamental Analysis Of Ambuja Cements – Key Metrics

We are now almost at the end of our fundamental analysis of Ambuja Cements. Let us have a quick look at some of its key metrics.

CMP ₹506 Market Cap (Cr.) ₹100,500
EPS 42 Stock P/E ₹2.00
ROCE 16% ROE 11%
Face Value ₹2.0 Book Value ₹129
Promoter Holding 63.2% Price to Book Value 3.93
Debt to Equity 0.02 Dividend Yield 1.24%
Net Profit Margin 13% Operating Profit Margin 19%

In Conclusion

In this article, we performed a fundamental analysis of Ambuja Cements. From what we have learned, we can say that Ambuja Cements was a comfortably nestled company in a cyclical, slow-moving industry. The same was reflected in its stock price which moved only 77% in the last five years.

However, since the announcement of Adani’s acquisition of the two companies in mid-May this year, Ambuja Cements has appreciated over 46% in value. This comes on the heels of huge plans Gautam Adani has announced for the cement companies. It will be interesting to track the growth story of the company from this point.

In your opinion, should the investors climb to Ambuja’s rising stock wall right now? Or should they wait for material developments in the company? How about you let us know in the comments below?

You can now get the latest updates in the stock market on Trade Brains News and you can even use our Trade Brains Portal for fundamental analysis of your favorite stocks.

The post Fundamental Analysis of Ambuja Cements – Overview, Future Plans & More appeared first on Trade Brains.

Via

https://ift.tt/rp2Q1NB

Monday, October 31, 2022

Fusion Micro Finance IPO Review – GMP, Strengths, Weaknesses & More!

Fusion Micro Finance IPO Review - Cover Image

Fusion Micro Finance IPO Review: Fusion Micro Finance Limited is coming up with its Initial Public Offering. The IPO will open for subscription on November 2nd, 2022, and close on November 4th, 2022. It is looking to raise Rs 1,103.99 Crores out of which Rs 600 Crores will be a fresh issue and the rest Rs 503.99 crores will be an offer for sale.

In this article, we will look at the Fusion Micro Finance IPO Review 2022 and analyze its strengths and weaknesses. Keep reading to find out!

Fusion Micro Finance IPO Review – About The Company

Fusion Micro Finance is a microfinance company providing financial services to underserved women across India in order to facilitate their access to greater financial opportunities. In fact, 92.26% of the company’s total Asset Under Management (AUM) falls under Rural areas.

The company stands as one of the youngest companies among the top 10 NBFC-MFIs in India in terms of AUM as of March 31, 2021, according to CRISIL. In addition to that,  the company had the third fastest gross loan portfolio growth of 44% among the top NBFC-MFIs in India between the financial years 2018 and 2021.

The company has a strong reach with 2.12 million active borrowers who are served through a network of 725 branches spread across 326 districts and 18 states and union territories in India, as of March 31, 2021.

The competitors of the company

Fusion Micro Finance IPO Review - Industry

(Source: DRHP of the company)

Fusion Micro Finance IPO Review – Financial Highlights

Financials

(Source: DRHP of the company)

Fusion Micro Finance IPO Review – Industry Overview

The microfinance industry has recorded healthy growth in the past few years. The industry’s gross loan portfolio increased at a CAGR of 28% since the financial year 2017 to reach approximately ₹2.7 trillion in the financial year 2021. 

The NBFC-MFIs are expected to grow at a faster pace than the industry at a CAGR of 18-20% between the financial years 2021 and 2024. The share of NBFC-MFIs share is expected to increase to 34% by the financial year 2024.

CRISIL Research expects the share of the rural segment in MFIs’ business to remain higher, with increasing demand expected from this segment. Going forward as well, for MFIs, rural clientele is expected to remain high in the range of 55-60% compared to urban clientele.

Strengths of the Company

  • The company has a well-diversified and extensive Pan-India presence.
  • The company had the second-highest growth in the number of customers among the top ten NBFC-MFIs in India in the financial year 2021.
  • The company has a diversified and cost-effective source of procuring capital.
  • The company has an advanced operating model as they leveraged technologies such as artificial intelligence and machine learning for their digital platform- Shakti
  • The company has a stable and experienced management team supported by Marquee Investors.

Weaknesses of the Company

  • The company serves customers in Rural area with limited sources of income and thus lack any credit history. This raises the risk of defaults for the company.
  • The company has certain inherent risks such as interest rate risks and technological risks.
  • The company operates in a highly regulated sector. Any changes by the Central bank (RBI) in the policies can adversely affect their business.
  • The company is subject to maintaining a certain portion of its funds as provisions that it must maintain at all times. This can reduce their capital in hand which might affect their business.
  • The company has certain pending legal proceedings in connection with unauthorized transactions, fraud, or misappropriation by its employees and other proceedings against the directors of the company.

Fusion Micro Finance IPO Review- Grey Market Information

The shares of Fusion Micro Finance traded at a premium of 10% in the grey market on October 31st, 2022. The shares tarded at Rs 405. This gives it a premium of Rs 37 per share over the cap price of Rs 368. 

Fusion Micro Finance IPO Review- Key IPO Information

Particulars Details
IPO Size ₹ 1,103.99 Crore
Fresh Issue ₹ 600.00 Crore
Offer for Sale (OFS) ₹ 503.99 Crore
Opening date November 2, 2022
Closing date November 4, 2022
Face Value ₹10 per share
Price Band ₹350 to ₹368 per share
Lot Size 40
Minimum Lot Size 1 (40 Shares)
Maximum Lot Size 13 (520 Shares)
Listing Date November 15, 2022

Promoters: Devesh Sachdev, Creation Investments Fusion, Llc, Creation Investments Fusion Ii, Llc, and Honey Rose Investment Ltd.

Book Running Lead Managers: ICICI Securities Limited, CLSA India Private Limited, IIFL Securities Limited, and JM Financial Limited.

Registrar To The Offer: Link Intime India Private Limited

The objective of the Issue

The Net Proceeds from the Fresh Issue are proposed to be utilized for the Augmentation of the capital base of the Company.

In Closing

In this article, we looked at the details of Fusion Micro Finance IPO Review 2022. Analysts remain divided on the IPO and its potential gains. This is a good opportunity for investors to look into the company and analyze its strengths and weaknesses. That’s it for this post.

Are you applying for the IPO? Let us know in the comments below.

You can now get the latest updates in the stock market on Trade Brains News and you can even use our Trade Brains Portal for fundamental analysis of your favourite stocks

The post Fusion Micro Finance IPO Review – GMP, Strengths, Weaknesses & More! appeared first on Trade Brains.

Via

https://ift.tt/atvd9Cc

Sunday, October 30, 2022

Top Stocks Under Rs 3500 to add to your watchlist – Detailed Analysis

Top Stocks under Rs 3500 - Cover image

Top Stocks Under Rs 3500: Stocks like MRF often make it hard for retail investors to buy them. This is because one would have to shell out upwards of Rs. 80,000 to buy one share. However, the good news for investors is that there is no shortage of great companies that one can buy for a sum of Rs 3500 per share.

In this article, we will take a look at the top stocks under Rs 3500.

So without further ado, let us jump in.

Top Stocks Under Rs 3500

There are many stocks that are listed in NSE and BSE for the share price of Rs 3500 and below. Let’s check which are those and more.

Top Stocks Under Rs 3500 #1 – Tata Consultancy Services

Top Stocks Under Rs 3500 - TCS Logo

Tata Consultancy Services (TCS) Ltd. is the crown jewel of the Tata Group. It is the second-largest Indian company after Reliance Industries in terms of market capitalization. It accounts for most of the earnings of Tata Sons, the holding company of the Tata Group. 

TCS is an IT services company and earns its revenues from America and Europe chiefly. It provides software services in 5 major industries: banking, finance services & insurance, retail & consumer business, communication, media & technology, and manufacturing.

The IT major offers a broad range of services: analytics & insights, automation & AI, blockchain, cloud, consulting, cyber security, enterprise applications, IoT & digital engineering, quality engineering, and more.

Recently the company has also taken an active role to lead the digital ventures of Tata Group. 

For a large-cap company, TCS has generated impressive returns for its shareholders over the last five years. Its stock has appreciated at a CAGR of 19.41% every year during the period.

CMP ₹3,143 Market Cap (Cr.) ₹1,150,000
EPS ₹108 Stock P/E 29.1
ROCE 54.9% ROE 43.6%
Face Value ₹1.0 Book Value ₹266
Promoter Holding 72.3% Price to Book Value 11.8
Debt to Equity 0.08 Dividend Yield 1.36%
Net Profit Margin 20% Operating Profit Margin 27.7%

Top Stocks Under Rs 3500 #2 – Adani Enterprises

Top Stocks Under Rs 3500 - Adani Logo

Adani Enterprises Ltd. (AEL) is the flagship company of the Adani Group. It was started as a commodity trading company in 1988 by Gautam Adani, a first-generation billionaire, and founder. It got listed in 1994.

Since then Adani Enterprises has grown into an incubator and holding company with diverse business holdings.

AEL is one of the largest Indian conglomerates with operations across multiple industries: airports, data centers, defense & aerospace, edible oil & foods, agro, integrated resources management, mining services, road, metro & rail, solar manufacturing, and water. It has grown organically and inorganically over the years. 

Recently, Adani Enterprises entered into a joint venture with EdgeConneX (the world’s largest private data center operator) to build data center facilities of 1GW over the next ten years. 

In addition to this, Gautam Adani announced a large investment of $ 100 billion by the Adani Group over the next ten years. Out of it, $ 70 billion is earmarked for an integrated hydrogen-based value chain.

Adani New Industries Ltd., a subsidiary of Adani Enterprises will be implementing green hydrogen projects as part of this large investment.

CMP ₹3,273 Market Cap (Cr.) ₹373,000
EPS ₹8.71 Stock P/E 385
ROCE 7.28% ROE 4.12%
Face Value ₹1.0 Book Value ₹186
Promoter Holding 72.3% Price to Book Value 17.6
Debt to Equity 2.04 Dividend Yield 0.03%
Net Profit Margin 1.13% Operating Profit Margin 5.35%

Top Stocks Under Rs 3500 #3 – Asian Paints

Top Stocks Under Rs 3500 - Asian Paints Logo

Based out of Mumbai, India, Asian Paints Ltd. is India’s largest, Asia’s 3rd largest, and the world’s 9th largest paint producer. The company was started in the 1940s by four friends. 

It has 26 paint manufacturing plants with operations across 15 countries. It offers a broad range of products and services. Its chief offerings include paints, wall coverings, and waterproofing. 

Along with this, it also sells wall stickers, adhesives, modular kitchens and wardrobes, bath fittings, sanitaryware, sanitizers, furnishings & lighting services, interior design services, and other products and services.

Decorative business accounts for almost 85% of the group’s revenue. Asian Paints derives 10% of its revenues from international sales. 

This makes it India’s largest paint company with a 40% combined market share and 55% in the decorative paint category.

The company has incorporated two 50:50 joint ventures with PPG Inc, an American Fortune 500 company to cater to automotive coatings and industrial coatings demand.

CMP ₹3,222 Market Cap (Cr.) ₹310,000
EPS ₹36.30 Stock P/E 86.4
ROCE 29.70% ROE 23.20%
Face Value ₹1.0 Book Value ₹144
Promoter Holding 52.6% Price to Book Value 22.4
Debt to Equity 0.11 Dividend Yield 0.59%
Net Profit Margin 10.80% Operating Profit Margin 16.50%

Top Stocks Under Rs 3500 #4 – PI Industries

PI Industries Logo

PI Industries was founded in 1946 as Mewar Oil and General Mills Ltd. The company started the formulation and marketing of agrochemicals in 1961. Fast forward to the present date, Gurgaon-headquartered PI Industries produces & sells fertilizers and specialty products.

It also provides various services such as research & development, custom synthesis & manufacturing solutions, distribution services, and more. 

It has a workforce of 3,000 employees. Its 5 formulation facilities and 15 multipurpose plants at 5 manufacturing locations provide it with an integrated development process: process synthesis, scaling up, and commercialization.

Its research and development center in Udaipur houses more than 400 scientists and researchers with advanced research and development labs, kilo plants, and pilot plants with NABL certification.

PI Industries earned 76.42% of its revenues in FY22  internationally. India only contributed Rs. 1,197 crores of the total Rs. 5,077 crore revenue for the company. This places the agrochemicals company in a sweet spot as the global demand for fertilizers is expected to improve in the near future. 

CMP ₹3,090 Market Cap (Cr.) ₹47,000
EPS ₹60.6 Stock P/E 51
ROCE 17.3% ROE 14.7%
Face Value ₹1.0 Book Value ₹403
Promoter Holding 46.7% Price to Book Value 7.68
Debt to Equity 0.05 Dividend Yield 0.20%
Net Profit Margin 15.9% Operating Profit Margin 21.7%

Top Stocks Under Rs 3500 #5 – Alkem Laboratories

Alkem Logo

Alkem Laboratories was started almost 4 decades ago in 1973. Over the years, the company has grown to become one of India’s largest generic and specialty pharmaceutical players with a presence in more than 40 countries.

Alkem went public in December 2015, listing its shares on the Bombay Stock Exchange Limited and the National Stock Exchange of India Limited.

It has a strong portfolio of brands such as Clavam, Pan, Pan-D, and Taxim-O. In the last 10 years, its foothold in the anti-infective segment has remained particularly strong. In total, the company has over 800 brands with over 1,300 SKUs for a broad range of therapy segments.

The pharma company has 20 manufacturing sites at multiple locations across India and the USA. It employs more than 17,000 people.

Alkem has a low debt-to-equity ratio of 0.31. The company has an impressive return on equity ratio of 20.7% and a return on capital employed at 18.6%. 

CMP ₹3,100 Market Cap (Cr.) ₹37,000
EPS ₹109 Stock P/E 28.2
ROCE 18.6% ROE 20.7%
Face Value ₹2.0 Book Value ₹722
Promoter Holding 57.1% Price to Book Value 4.28
Debt to Equity 0.31 Dividend Yield 1.09%
Net Profit Margin 15.9% Operating Profit Margin 19.3%

List of Top Stocks Under Rs 3500 

The table below presents a list of top stocks under Rs 3500 along with their industry, market capitalization and share price.

Company Name Industry CMP (Rs.) Market Cap (Rs. Cr.)
Tata Consultancy Services IT Services 3,143 1,150,000
Adani Enterprises Diversified 3,273 373,000
Adani Transmission Oil & Gas 3,183 355,000
Adani Total Gas Gas Distribution 3,154 347,000
Asian Paints Paints 3,222 310,000
ABB India Infrastructure 3,228 68,500
Mindtree IT Services 3,444 57,000
Schaeffler India Bearings 3,210 50,000
P I Industries Agrochemicals 3,090 47,000
Alkem Laboratories Pharmaceuticals 3,100 37,000

In Conclusion

Above we looked at some of the top stocks under Rs 3500. It might be a good approach to sort stocks on the basis of their stock price and market capitalization. But it should not be the only parameter investors should keep in mind while making investment decisions. 

Additionally, an investor should diversify by including companies from different sectors and of different sizes to protect her downside.

As an investor, what points do you keep in mind while picking stocks? How about you let us in the comments below?

You can now get the latest updates in the stock market on Trade Brains News and you can even use our Trade Brains Portal for fundamental analysis of your favorite stocks.

The post Top Stocks Under Rs 3500 to add to your watchlist – Detailed Analysis appeared first on Trade Brains.

Via

https://ift.tt/atvd9Cc

Thursday, October 27, 2022

DCX Systems Limited IPO Review 2022 – GMP, Strengths, & More!

DCX Systems IPO Review - Cover Image

DCX Systems Limited IPO Review: DCX Systems Limited is coming up with its Initial Public Offering. The IPO will open for subscription on October 31st, 2022, and close on November 2nd, 2022. It is looking to raise Rs. 500 Crores out of which Rs. 400 Crores will be a fresh issue and the rest Rs. 100 Crores will be an offer for sale.

In this article, we will look at the DCX Systems IPO Review 2022 and analyze its strengths and weaknesses. Keep reading to find out!

DCX Systems IPO Review – About The Company

DCX Systems Limited is among the leading Indian players in the manufacture of electronic sub-systems and cable harnesses in terms of manufacturing capability and revenue in Fiscal 2021.

The company is primarily engaged in system integration and manufacturing of a comprehensive array of cables and wire harness assemblies. In addition to that, it is also involved in kitting.

Some of the customers of the company include names like Bharat Electronics Limited, Alpha Design Technologies Private Limited, Alpha Elsec Defence and Aerospace Systems Private Limited, and Centum Adeno India Private Limited.

DCX Systems IPO Review - Financials

The business verticals of the company include:

System Integration: The company provides product assembly and system integration services for various complexities to address customers’ requirements. They also provide product repair support.

Cable and Wire Harness Assemblies: They manufacture a comprehensive array of cables and wire harnesses assemblies such as radio frequency cables, co-axial, mixed-signal, power, and data cables for a variety of uses including communication systems, sensors, surveillance systems, missile systems, military armored vehicles, and other electronic warfare systems for the aerospace and defense industries.

Kitting: The company supplies assembly-ready kits of electronic and electro-mechanical parts and undertakes all aspects of procurement including sourcing components from suppliers.

The competitors of the company are:

  • Data Patterns Private Limited
  • Astra Microwave Products Limited
  • Centum Electronics Limited
  • Bharat Electronics Limited
  • Paras Defence and Space Technologies Limited

DCX Systems IPO Review – Financial Highlights

(Source: DRHP of the company)

DCX Systems IPO Review – Industry Overview

The defense manufacturing industry in India is an integral segment of the country’s economy. To date, India has been among the top importers of defense equipment. However, the massive focus on ‘Make in India’ is set to change this.

Recent initiatives like an increase in foreign direct investment (“FDI”) in the Indian defense sector from the current 49% to 74% under the automatic route are anticipated to be key drivers and growth opportunities for the market.

The Indian aerospace and defense sector is poised to attain a value of USD 70 billion by 2030. While the Indian Defence segment plans to achieve a turnover of ₹ 1.75 trillion and exports worth ₹ 35,000 million are aimed by the year 2025. 

Strengths of the Company

  • The company is one of the preferred Indian Offset Partners for the defense and aerospace industry with global accreditations.
  • The company has a Strategically located advanced and modern manufacturing facility at the Hi-Tech Defence and Aerospace Park SEZ in Bengaluru, Karnataka.
  • It has established strong relationships with its existing customers over the years and is also looking to penetrate into new geographies.
  • The company is well-positioned in the industry with consistently good performance over the years.
  • The company is led by Experienced and qualified Promoters and a senior management team.

Weaknesses of the Company

  • A significant portion of their revenue from operations is generated from the offset defense contracts. Any changes can affect the business.
  • It is highly dependent on the performance of the electronic subsystems market. Any changes in the conditions can adversely impact their business.
  • The company is exposed to risks such as foreign currency fluctuations.
  • The company operates in a highly competitive market with factors such as rapid technological change, the development of new end products, their rapid obsolescence, and evolving industry standards.
  • The company has high debt on its balance sheet and thus a high debt-to-equity ratio.

DCX Systems IPO Review- Grey Market Information

The shares of DCX Systems traded at a premium of 38.65% in the grey market on October 27th, 2022. The shares tarded at Rs 287. This gives it a premium of Rs 80 per share over the cap price of Rs 207.

DCX Systems IPO Review- Key IPO Information

DCX Systems IPO Review - Information

Promoters: Dr. H.S. Raghavendra Rao, Ncbg Holdings Inc., and Vng Technology Private Limited

Book Running Lead Managers: Edelweiss Financial Services Limited, Axis Capital Limited, and Saffron Capital Advisors Private Limited

Registrar To The Offer: Link Intime India Private Limited

Particulars Details
IPO Size ₹ 500 Cr
Fresh Issue ₹ 400 Cr
Offer for Sale (OFS) ₹ 100 Cr
Opening date October 31, 2022
Closing date November 2, 2022
Face Value ₹ 2 per share
Price Band ₹ 197 to ₹ 207 per share
Lot Size 72 Shares
Minimum Lot Size 1 (72 shares)
Maximum Lot Size 13 (936 shares)
Listing Date November 11, 2022

The Objective of the Issue

The Net Proceeds from the Fresh Issue are proposed to be utilized for: 

  • Repayment/ prepayment, in full or part, of certain borrowings availed of by the Company.
  • Funding working capital requirements.
  • Investment in their wholly-owned Subsidiary, Raneal Advanced Systems Private Limited, to fund its capital expenditure expenses.
  • General corporate purposes

In Closing

In this article, we looked at the details of DCX Systems Limited IPO Review 2022. Analysts remain divided on the IPO and its potential gains. This is a good opportunity for investors to look into the company and analyze its strengths and weaknesses. That’s it for this post.

Are you applying for the IPO? Let us know in the comments below.

You can now get the latest updates in the stock market on Trade Brains News and you can even use our Trade Brains Portal for fundamental analysis of your favorite stocks.

The post DCX Systems Limited IPO Review 2022 – GMP, Strengths, & More! appeared first on Trade Brains.

Via

https://ift.tt/dhF1DYU

Wednesday, October 26, 2022

30 Important Candlestick Patterns Every Trader Should Know

30 Important Candlestick Patterns - Cover Image

30 Important Candlestick Patterns: The stock market constitutes emotions as it consists of a large number of people. These emotions can be largely responsible for the movements in the market. As people tend to exhibit similar behavior when dealing with familiar situations, the overall market movements can be understood to an extent using candlesticks.

Candlesticks are one of the important tools that help us in technical analysis. These 30 important candlestick patterns can help us recognize the interaction between the buyers and sellers in the market.

In this article, we will be covering 30 important candlestick patterns that every trader should know

What is a candlestick?

A candlestick is a type of chart that indicates the opening price, the high, the low, and the closing price of a security for a specific time period.

A candlestick pattern comprises a body and a wick which shows us the information of the price in a simple and concise manner.

The body of the candle indicates the price at which a security has opened and closed during a specific time period. The wick or the shadow of the candle indicates the high and low security reached during a specific time period.

A Candlestick can be divided into two categories:

  • Bullish Candlestick
  • Bearish Candlestick

Bullish Candlestick: A candle is said to be bullish when the body of the candle is green. In this candle, the bottom of the body represents the opening price and the top of the candle represents the closing price.

Bearish Candlestick: A candle is said to be bearish when the body of the candle is red. In this candle, the top of the body represents the opening price and the bottom of the candle represents the closing price.

Candlestick patterns - Basics

Now that we have understood how a candlestick looks, we will now look into 30 important candlestick patterns and understand how they represent the different sentiments in the market. 

30 Important Candlestick Patterns and How are they read

Below are the 30 important candlestick patterns that every trader should know before investing in the stock market

Single Candlestick pattern

Important Candlestick Patterns #1 – Marubozu Candlestick

A marubozu candlestick is a single candlestick formation that makes a big movement in a single direction with any pushback from the opposite direction. Marubozu candlesticks can be divided based on their bullish or bearish momentum

Bullish Marubozu Candlestick

This candlestick pattern represents extreme bullishness in the market. This candle indicates that the buyers are in control of the stock price throughout the trading session. In this candle, the low is the opening price and the high is the closing price for the session.

Candlestick patterns - Bullish Maribozu

Bearish Marubozu Candlestick

This candlestick pattern represents extreme bearishness in the market. This candle indicates that the sellers are in control of the stock price throughout the trading session. In this candle, the high is the opening price and the low is the closing price for the session.

Candlestick patterns - Bearish Maribozu

Important Candlestick Patterns #2 – Bullish Hammer

A bullish candlestick is a formation that appears after a falling trend in the market. This candle indicates that the market is likely going to make a reversal uptrend. This candle can be characterized by a small body and a wick at the bottom which is twice the size of the body.

The larger the wick of the candle, the better the chances are for its reversal. The body of the candle can be either green or red. This candle is formed at the bottom of the chart.

Candlestick patterns - Bullish hammer

Important Candlestick Patterns #3 – Hanging man

A hanging man is a candle pattern that looks identical to a bullish hammer. But the candle appears after an uptrend with an indication that the market is likely to make a reversal downtrend.

Candlestick patterns - Hanging Man

Important Candlestick Patterns #4 – Bullish Inverted Hammer

An inverted hammer is a candle formation that occurs at the bottom of the downtrend. It acts as a trigger for a potential upside in the market. This candle pattern has a small body and a wick only at the top which is as twice the size of the body.

The larger the wick of the candle, the better the chances are for its reversal. The body of the candle can be either green or red. This candle is formed at the bottom of the chart.

Candlestick patterns - Bullish Inverted Hammer

Important Candlestick Patterns #5 – Shooting star 

A shooting star pattern looks identical to a candle pattern but appears at the top of the uptrend. This candle is a trigger that indicates that markets may likely reverse downwards.

Candlestick patterns - Shooting Star

Doji candlestick Patterns

Dojis are candlestick patterns with wicks and nobody. A Doji candle opens and closes at the same price. The Doji candlestick patterns are of four types:

Important Candlestick Patterns #6 – Neutral Doji:

A neutral Doji is a candle pattern with no conviction of its own. This candle pattern indicates an equal number of buying and selling pressure. The future price movement will be uncertain in this pattern

Candlestick patterns - Neutral doji

Important Candlestick Patterns #7 – Long-Legged Doji

A long-legged Doji candle is considered the most prominent when they appear during a strong uptrend or a downtrend. The long-legged doji signal indicates that supply and demand are approaching balance and that a trend reversal may take place.

Candlestick patterns - Long Legged Doji

Important Candlestick Patterns #8 – Dragonfly Doji

Dragonfly Doji is a candlestick pattern that indicates a bullish reversal in the market. It mainly appears at the bottom of the downtrend.

A dragonfly Doji is formed when the open, high, and close are on the same price level and has a long lower wick 

Candlestick patterns - Bullish Dragonfly doji

Important Candlestick Patterns #9 – Bearish Gravestone Doji

Gravestone Doji is a candlestick pattern that indicates a bearish reversal in the market. It mainly appears at the top of the uptrend.

A dragonfly Doji is formed when the open, low, and close are on the same price level and has a  long upper wick 

Candlestick patterns - Gravestone Doji

Important Candlestick Patterns #10 – Spinning Top Candlestick

The spinning top is a candlestick pattern that is similar to a Doji candlestick which indicates indecision between the buyer and the seller in the market. 

The only differentiation between a Doji and a spinning top candle is their formation. The body of the spinning top is slightly larger when compared to a Doji. Due to the relatively small change in the market direction, it is known as a continuation pattern

Spinning top Candlestick can be divided into bullish and bearish forms depending on their opening and closing prices.

Candlestick patterns - Spinning Top

Double Candle Candlestick Patterns 

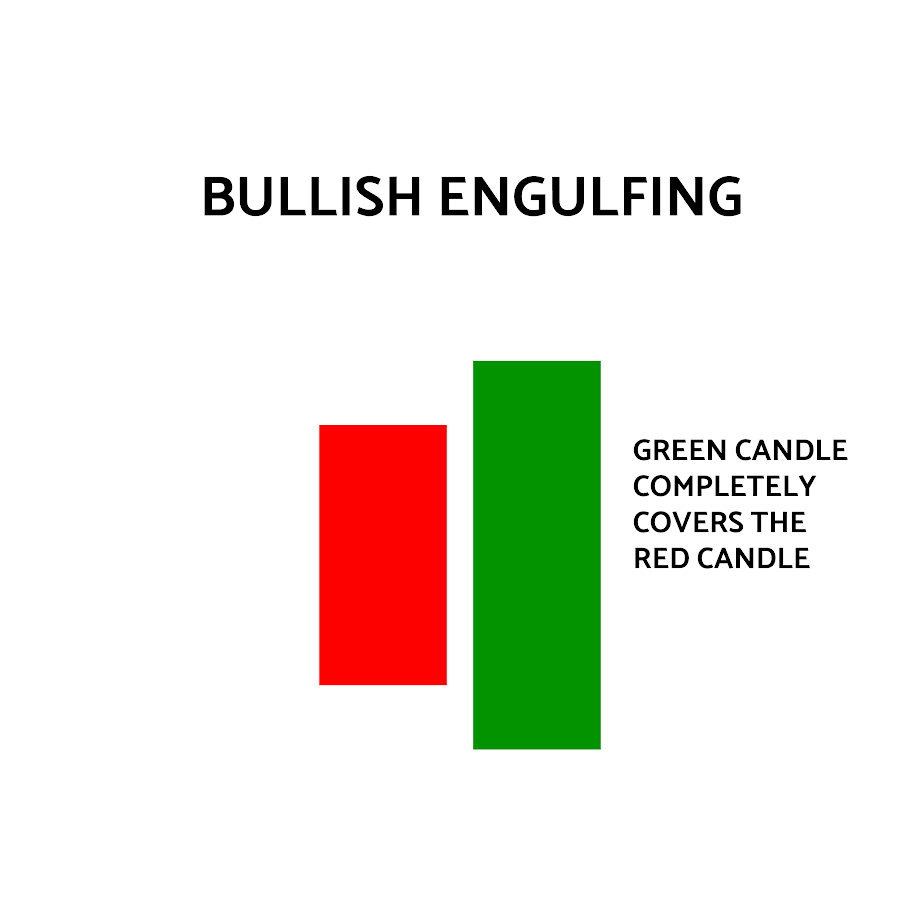
Important Candlestick Patterns #11 – Bullish engulfing

Bullish engulfing is a two-candlestick chart pattern that is formed when a red candle is followed by a large green candle that completely covers or engulfs the previous candlestick stick

In this pattern, the green candle opens below the red candle and closes above the red candle indicating a bullish signal in the market.

Candlestick patterns - Bullish Engulfing

Important Candlestick Patterns #12 – Bearish engulfing 

Bearish engulfing is a two-candlestick chart pattern that is formed when a green candle is followed by a red candle that completely covers or engulfs the previous candlestick stick

In this pattern, the red candle opens above the green candle and yet closes below the green candle indicating a bullish signal in the market.

Candlestick patterns - Bearish Engulfing

Important Candlestick Patterns #13 – Bullish Harami

A bullish harami is a pattern that is formed after a bear trend in the market. 

This pattern is formed when there is a large red candle followed by a small green candle inside the previous red candle. This pattern indicates the return of bulls in the market.

Candlestick patterns - Bullish Harami

Important Candlestick Patterns #14 – Bearish Harami

A Bearish harami is a pattern that is formed after a bull trend in the market. 

This pattern is formed when there is a large green candle followed by a small red candle inside the previous green candle. This pattern indicates the return of bears in the market.

Candlestick patterns - Bearish Harami

Important Candlestick Patterns #15 – Bullish Harami cross

A bullish harami cross is a pattern that is formed after a downtrend in the market. 

This pattern consists of a long red candle followed by a Doji candle that is located in the middle of the previous candle. This pattern forecasts a bull trend in the market.

Candlestick patterns - Bullish Harami Cross

Important Candlestick Patterns #16 – Bearish Harami cross

A bearish harami cross is a pattern that is formed after an uptrend in the market. 

This pattern consists of a long green candle followed by a Doji candle that is located in the middle of the previous candle. This pattern forecasts a downward trend in the market.

Candlestick patterns - Bearish Harami Cross

Important Candlestick Patterns #17 – Bullish Piercing Line

A Bullish Piercing Line is a candlestick pattern that indicates a reversal after an extended downtrend in the market. This formation indicates a resumption of the uptrend in the market

This candle formation consists of a red candle followed by a green candle which opens gap down and covers more than 50% of the previous candle while closing.

Candlestick patterns - Bullish Piercing Line

Important Candlestick Patterns #18 – Dark cloud cover

A Dark cloud cover is a bearish pattern that indicates a reversal after an uptrend in the market

This candle formation consists of a green candle followed by a red candle which opens gap up and covers more than 50% of the previous candle while closing.

Candlestick patterns - Dark Cloud Cover

Important Candlestick Patterns #19 – Tweezer Bottom Candlestick

A tweezer bottom is a bullish candlestick pattern that is formed at the end of a downtrend in the market. It is formed when the sellers are not able to push the prices down any further in the market.

This pattern consists of a red candle which is followed by a green candle. The green candle will have the same low as the red candle indicating support at that level

Candlestick patterns - Tweezer Bottom Candlestick

Important Candlestick Patterns #20 – Tweezer Top Candlestick

A tweezer top is a bearish candlestick pattern that is formed after an uptrend in the market. This pattern indicates the buyers not being able to push the price higher.

This pattern consists of a green candle which is followed by a red candle. The red candle will have the same high as the green candle indicating a resistance at that level.

Candlestick patterns - Tweezer Top

Important Candlestick Patterns #21 – Bullish homing pigeon

The bullish homing pigeon is a candlestick pattern that indicates the weakening of the current downtrend and shows the likelihood of a reversal

The pattern consists of a large red candle followed by another red candle within the range of the first candle

Candlestick patterns - Bullish Homing Pigion

Important Candlestick Patterns #22 – Bearish homing pigeon

The bearish homing pigeon is a candlestick pattern that indicates the weakening of the uptrend in the market and indicates the market reversal

The pattern consists of a large green candle followed by another green candle within the range of the first candle

Candlestick patterns - Bearish Homing Pigion

Triple Candle Candlestick Patterns

Important Candlestick Patterns #23 – Three white soldiers

Three white soldiers is a candlestick pattern that indicates bullishness in the market. This candle pattern is formed when long-bodied green candles appear that are close higher than the previous candle for three consecutive sessions.

Three White Soldiers

Important Candlestick Patterns #24 – Three black crows

Three black crows is a candlestick pattern that indicates a downtrend in the market. This candle pattern is formed when long-bodied red candles appear that are close lower than the previous candle for three consecutive sessions.

Three Black Crows

Important Candlestick Patterns #25 – Bullish Upside Tasuki gap

The Upside Tasuki gap is a candlestick pattern that indicates a continuation of the bullish trend in the market

This is a three-candle formation that consists of a large green candle followed by another green candle that has gapped above the previous candle. And the third candle that closes between the gaps of the previous two bars

Bullish Upside Tasuki Gap

Important Candlestick Patterns #26 – Bearish Downside Tasuki gap

The Downward Tasuki gap is a candlestick pattern that indicates a continuation of the downtrend in the market.

This pattern consists of a large red candle followed by another red candle that has gapped down below the previous candle. And the third candle that closes between the gaps of the previous two bars

Bearish Downside Tasuki Gap

Important Candlestick Patterns #27 – Morning star pattern

A Morningstar pattern is a candlestick formation that occurs after a downtrend in the market. This candle pattern signals the beginning of an uptrend in prices.

This candle pattern consists of a red candle followed by a small-bodied candle that closes below the previous candle. The third candle will be a large green candle that opened above the second candle.

The second candle can either be a green or a red candle.

Morningstar Pattern

Important Candlestick Patterns #28 – Evening star pattern

An evening star pattern is a candlestick formation that after an uptrend in the market. This candle pattern signals a downtrend in the market.

Evening Star Pattern

This candle pattern consists of a green candle followed by a small-bodied candle that closes above the previous candle. The third candle will be a large red candle that opened below the second candle.

The second candle can either be a green or a red candle

Important Candlestick Patterns #29 – Three inside up 

The three inside up is a candlestick formation that is formed at the bottom of the downtrend. It is a bullish pattern that indicates the reversal of the downtrend in the market

It is a three-candle pattern consisting of a long red candle followed by a green candle that covers the first candle at least till the midpoint. The third candle should be a green candle that should close above the first candle indicating the buyers overpowering the sellers.

Three Inside Up

Important Candlestick Patterns #30 – Three inside down

The three inside down is a candlestick formation that is formed at the top of an uptrend. It is a bearish pattern that indicates the reversal of the uptrend in the market.

It is a three-candle pattern consisting of a long green candle followed by a red candle that covers the first candle at least till the midpoint. The third candle should be a red candle that should close below the first candle indicating the sellers overpowering the buyers.

Three Inside Down

Conclusion

In this article, we discussed 30 important candlestick patterns divided as single candlestick patterns, double candlestick patterns, and triple candle stick pattern

Knowing the different 30 important candlestick patterns can help in knowing how the market psychology works and using these candle patterns along with other technical tools can help you take better trades in the market.

You can now get the latest updates in the stock market on Trade Brains News and you can even use our Trade Brains Portal for fundamental analysis of your favorite stocks.

The post 30 Important Candlestick Patterns Every Trader Should Know appeared first on Trade Brains.

Via

https://ift.tt/EM0tTAj