Tuesday, January 31, 2023

Fundamental Analysis of Prince Pipes And Fittings

Fundamental Analysis of Prince Pipes and Fittings - Cover Image

Fundamental Analysis of Prince Pipes and Fittings: Pipes form an integral part of infrastructure development. I mean, imagine homes and cities without pipes! We would have to go to rivers and ponds to fetch water. And imagine doing that when you have to reach the office by 10 AM after completing daily chores. That would be time-consuming. Maybe, work timings would have to be entirely different.

In short, pipes are important. Important enough to build ₹ 6,800 crore companies! In this article, we shall do a fundamental analysis of Prince Pipes and Fittings, a company that has been around for more than three decades. We’ll take a look at its business, the industry that it functions in, its competitive strengths, financials, and more. Let’s begin.

About the Company

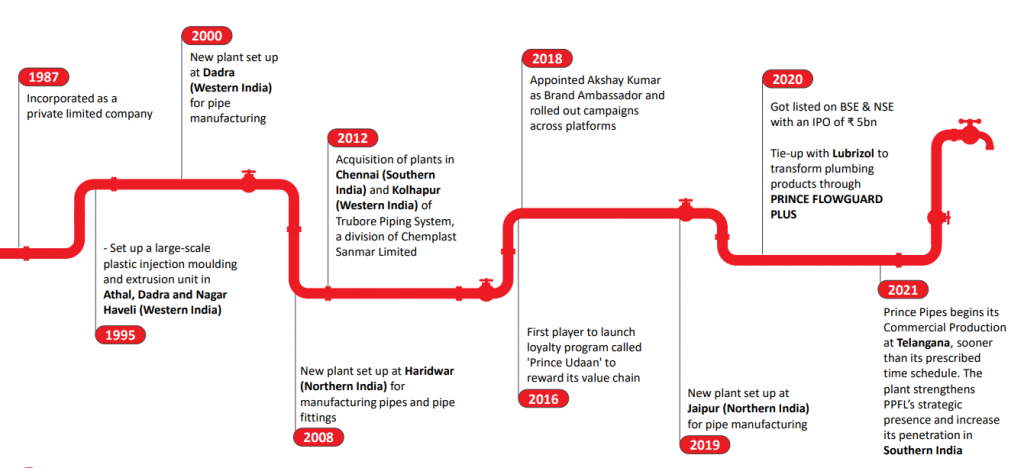
Prince Pipes & Fittings Limited (PPFL) is one of India’s largest integrated piping solutions and multi-polymer manufacturers. It has a history of more than 30 years and is a Fortune 500 company. It is promoted by the Chedda family and is recognized for its extensive range of products and pristine quality. The company manufactures polymer pipes and fittings for plumbing, irrigation, and sewage disposal.

PPFL has been considered the Industry’s Most Trusted Brand and has the Largest Range of SKUs. The company ranks amongst the top 5 companies in the piping industry. Thanks to its massive production capacity and wide distribution network. Having operated for more than three decades, the company has numerous manufacturing units located strategically across the country.

It markets its products under two renowned brands – Prince Piping Systems and Trubore Piping Systems. It has more than 1500 distributors and 7 state-of-the-art facilities across India.

These are located at Haridwar (Uttarakhand), Athal (Dadra and Nagar Haveli), Dadra (Dadra and Nagar Haveli), Kolhapur (Maharashtra), and Chennai (Tamil Nadu). Besides, two contract manufacturing units are located at Hajipur (Bihar), Aurangabad (Maharashtra), Jobner (Rajasthan), and Sangareddy (Telangana).
Fundamental Analysis of Prince Pipes And Fittings - Company overview

Industry Overview

Plastic pipes and fittings are used in irrigation, real estate, and for the development of water supply and sanitation. India has a low per capita consumption of pipes of 11 kg as compared to the world average of 30 kg. The market is estimated to grow at a CAGR of 12-14% annually till FY24. The growth outlook remains strong, driven by the Government’s focus on expanding areas under irrigation and increasing urban infrastructure spending.

In addition, the growing penetration of branded plumbing pipes in the affordable housing project segment would further lead to demand in the pipe segment. However, the recent correction across polymers prices could lead to lower industry growth in value terms, as a decrease in raw material prices would impact realizations.

About 600 million Indians face high-to-extreme stress over water. The Swachh Bharat Mission aims to achieve higher sanitation coverage with a budget of ₹ 12,294 crores. The Atal Mission For Rejuvenation And Urban Transformation aims to provide basic civic amenities like water supply, sewerage, urban transport, and perks to improve the quality of life with a budget of ₹ 77640 crores.

Branded pipes and fittings companies continued to gain strong industry leads and market share from unorganized manufacturers over the last few years. The growth of the organized segment has further been aided by a greater lateral focus on value-added products and fittings and product portfolio expansion offered to channel partners. Consequently, organized players have become one-stop solution providers for plumbing applications.

Competitive Strengths

  • Strong brand presence in the pipes and fittings segment
  • Domain knowledge and understanding of the pipes and fittings industry have helped the company to build a strong distribution network.
  • Multi-location manufacturing units in India
  • A pan-India network of distributors
  • Technical collaboration with international players to maintain the quality of products

IPO

The company raised ₹ 500 crores, comprising 50% as an offer for sale and 50% fresh issue. It had a price bank of ₹ 177 to ₹ 178 per share. However, it had a muted debut. It got listed at ₹ 160 per share, i.e. at a discount. Its shares closed at ₹ 627.90 per share on December 08, 2022. This means that it gave multibagger returns of 292.43% since its listing.

Prince Pipes and Fittings – Financials

Revenue & Profitability

Financials Chart
Year 2018 2019 2020 2021 2022
Revenue (₹ in Crores) ₹1,315.04 ₹1,571.87 ₹1,635.66 ₹2,071.52 ₹2,656.83
Profit (₹ in Crores) ₹72.77 ₹82.13 ₹112.51 ₹221.83 ₹249.40
Net Profit Margin 5.53 % 5.23 % 6.88 % 10.71 % 9.39 %

The company’s revenue, as well as profits, show an increasing trend. Its sales grew at a 3-year CAGR of 19.12%, while its profits grew at a 3-year CAGR of 44.81%. In addition, its net profit margin has been showing an increasing trend. It grew from 5.53% in the financial year 2017-18 to 9.39% in the financial year 2021-22. Similarly, its EBITDA margin grew from 12.3% in FY18 to 15.6% in FY22.

Prince Pipes and Fittings- Key Metrics

Particulars Values Particulars Values
Face Value (₹) 10 ROE (%) 21.63
Market Cap (₹ in Cr) 6,834.00 Net Profit Margin 9.39%
EPS (₹) 13.37 Current Ratio 1.89
Stock P/E (TTM) 46.32 Debt to Equity 0.11
Dividend Yield (%) 0.58 Promoter’s Holdings (%) 62.94

Prince Pipes and Fittings is a small-cap company with a market capitalization of ₹ 6834.00 crores as of December 08, 2022. It has earnings per share of ₹ 13.34, indicating that ₹ 13.34 is allocated to every individual share of the stock. A high EPS indicates good profitability. Its shares were trading at a price-to-equity ratio (P/E) of 46.34 which is lower than the industry P/E of 61.71. This could mean that the company’s stock is undervalued.

Return Ratios

The company has a good return on equity of 21.63%. This indicates that the company generates a good amount of profit on the equity that is employed in it. Further, it has a return on capital employed of 27.58%, indicating that it generates ₹ 27.58 for every ₹ 100 that is deployed in its business.

Debt & Liquidity Ratios

Prince Pipes and Fittings has a high debt-to-equity ratio of 1.15. This indicates that it is risky for lenders and investors. It suggests that the company is financing a significant amount of its potential growth through borrowing. This ratio varies from industry to industry, however, its peers have a debt-to-equity ratio ranging between 0 and 0.28.

Further, it has a current ratio of 2.19. This indicates that its current assets are almost twice its current liabilities. It has a dividend yield of 0.58. Prince Pipes and Fittings has a credit rating of A+ from CRISIL, indicating a stable outlook.

Shareholding

The company’s promoters hold a 62.94% stake in it. Retail investors hold an 18.50% stake, FIIs hold 4.41% and DIIs hold 15.45%. Further, there is no pledge against the promoters’ holding and their holding has decreased from 63.25% a year ago to 62.94% this year.

It has 11,05,61,079 outstanding shares. Some of the top institutional holders invested in the company include Mirae Asset (8.41%), Oman India Joint Investment Fund (2.54%), Kuwait Investment Authority (1.64%) New Mark Advisors LLP (1.13%), and Aditya Birla Sun Life Trustee Private Limited (1.05%).

Future Outlook of Prince Pipes And Fittings

Prince Pipes and Fittings aims to

  • expand its distribution network across target markets.
  • Introduce value-added products to ensure cost efficiency.
  • reduce costs to ensure comfortable EBITDA margins.
  • improve RoCE and RoE ratios by monitoring volume and price growth.

In Closing

In this article on the fundamental analysis of Prince Pipes and Fittings, we took a look at the company’s business, the industry in which it functions in, and its competitive advantage. Later we took a look at financial metrics like revenue, profitability, ratios and shareholding. That’s all for this article folks. We hope to see you around and happy investing until next time!

You can now get the latest updates in the stock market on Trade Brains News and you can also use our Trade Brains Stock Screener to find the best stocks.

The post Fundamental Analysis of Prince Pipes And Fittings appeared first on Trade Brains.

Via

https://ift.tt/SZ5WOhp

Monday, January 30, 2023

Fundamental Analysis of ICICI Bank – Company, Financials & More

Fundamental Analysis of ICICI Bank - Cover Image

Fundamental Analysis of ICICI Bank: Banks are crucial to the functioning of every economy. People and companies place a lot of trust in the banking system and turn to them for their funding needs. When the banking system collapses, the economy collapses. Therefore, banks flourish amidst all political, economic, and natural crises. This makes the banking sector an attractive sector for investment.

As it goes with every investment, we have to analyze stocks on our own before investing in them. However banking stocks are a little different from many other stocks. Investing in banks requires a careful analysis of financial data and not merely ratios.

In this article, we are going to perform a fundamental analysis of ICICI Bank, one of the largest private sector banks in India. We shall go through parameters like Capital Adequacy Ratio, CASA, Slippage, Gross & Net NPA, PCR, and more. Let’s begin!

Industry Overview

Indian banks are generally resilient and have withstood global downturns well, according to credit, liquidity, and market risk studies. The sector is sufficiently capitalized and well-regulated, according to the Reserve Bank of India (RBI).

During FY16-FY22, bank credit increased at a CAGR of 0.62%. As of FY22, total credit extended surged to US$ 1,532.31 billion. During FY16-FY22, deposits grew at a CAGR of 10.92% and reached US$ 2.12 trillion by FY22. Bank deposits stood at Rs. 173.70 trillion (US$ 2.12 trillion) as of November 4, 2022.

The government has taken various initiatives that are positive for the banking industry. National Asset Reconstruction Company (NARCL) will take over 15 non-performing loans (NPLs) worth Rs. 50,000 crores (US$ 6.70 billion) from banks.

An increase in the working population and growing disposable income will increase the demand for banking and related services. India’s fintech market is expected to reach ₹ 6.2 trillion (US$ 83.48 billion) by 2025, according to an IBEF report.

The Indian banking industry has recently witnessed the rollout of innovative banking models like payments and small finance banks. The country has also focused on increasing its banking sector reach, through schemes like the Pradhan Mantri Jan Dhan Yojana and Post payment banks.

In addition, major banking sector reforms like digital payments, neo-banking, a rise of Indian NBFCs, and fintech have significantly enhanced India’s financial inclusion and helped fuel the credit cycle in the country.

About the company

ICICI bank Logo

ICICI Bank was formed in 1955 at the initiative of the World Bank, the Government of India, and representatives of Indian industry. Their objective was to create a development financial institution for providing medium-term and long-term project financing to Indian businesses. In the 1990s once the financial sector got liberalized, the bank transformed its business from a development financial institution to a bank providing a variety of services.

The bank was originally promoted by ICICI Limited, an Indian financial institution, and was its wholly-owned subsidiary. Today, it is one of the largest private-sector banks in India. It offers a diversified portfolio of financial products and services to retail, SME, and corporate customers. The bank has an extensive network of branches, ATMs, and other touch points.

ICICI Bank – Financial Highlights

The primary business of banks is to accept deposits and give out loans. Deposits are their liabilities and loans are their assets. They pay interest on deposits and collect interest on loans. The difference is their profit. And that’s how banks earn.

2018 2019 2020 2021 2022
Net Interest Income (₹ in billion) 230.26 270.15 332.67 389.89 474.66
Net Interest Margin (in %) 3.23 3.42 3.73 3.69 3.96
Casa Ratio (in %) 51.32 48.78 44.84 46.17 48.6
Net NPA (in %) 4.8 2.1 1.4 1.1 0.8
Provision Coverage Ratio (in %) 47.7 70.6 75.7 77.7 79.2
Fundamental Analysis of ICICI Bank - Financials

Net Interest Income (NII)

The first parameter that we’ll check while doing the fundamental analysis of ICICI Bank is Net Interest Income (NII). It is the difference between the interest earned by a bank on loans that it provides and the interest paid by it on the deposits that it accepts. As indicated in the chart above, ICICI Bank’s NII shows an increasing trend. It grew from ₹ 230.26 billion in 2018 to ₹ 474.66 billion in 2022.

Net Interest Margin (NIM)

Net interest margin is a profitability metric. ICICI Bank’s net profit has grown over a period of five years, indicating that the net benefit of lending funds has increased. Generally, when the CASA Ratio is high, the NIM will be high. A positive NIM suggests that the bank is investing efficiently. ICICI Bank’s net interest margin shows an increasing trend. It grew from 3.23% in 2018 to 3.96% in 2022.

Current Account Saving Account (CASA)

Banks pay interest on deposits. The CASA ratio is the ratio of deposits in current and saving accounts to total deposits. Banks generally do not give any interest on current accounts and give very low interest on savings accounts. Therefore, a high CASA ratio indicates a lower cost of funds. ICICI Bank’s CASA ratio has shown a declining trend over a period of five years. It decreased from 51.32 in 2018 to 48.6 in 2022. However, it is higher than its peers like HDFC Bank (48.13) and State Bank of India (44.52).

Non-Performing Assets (NPA) & Provision Coverage Ratio (PCR)

Let’s say that you have lent ₹ 10,000 to your friend. He promises to repay the amount but fails to do so for more than 3 years. There is no hope of recovering the money as your friend has defaulted. Similarly, if borrowers default on interest or principal payments to a bank, they become non-performing assets (NPA).

A bank’s NPA is a crucial factor to consider while analyzing a banking stock. Too many NPAs adversely affect a bank’s liquidity and growth abilities. This is a big red flag. As the table indicates, ICICI Bank’s Net NPAs have decreased from 4.8% in 2018 to 0.8% of 2022, which is a good sign. In tandem with the NPAs, ICICI Bank’s provision coverage has increased from 47.7% in 2018 to 79.2% in 2022. The higher the provision, the safer a bank is when it faces a stressful situation.

Capital Adequacy

Capital Adequacy

Capital Adequacy Ratio measures the financial risk of banks. It examines the available funds with banks about extended credit weighted by exposure to various risks. In simple words, it ensures credit discipline in a bank and protects the depositors. The RBI has mandated a minimum requirement of Tier-1 capital at 8.875%.

Tier-1 capital absorbs losses without a bank being required to terminate trading. It is easily available to cushion losses sustained by a bank. It consists of equity capital, ordinary share capital, intangible assets, and audited revenue reserves.

Tier-2 capital absorbs losses in the event of bank liquidation. If the bank loses all its tier-1 capital, tier-2 capital is used to absorb losses. It provides a lesser degree of security to depositors. Hence it is observed as less secure than tier-1. It comprises unaudited retained earnings, unaudited reserves, and general loss reserves.

ICICI Bank’s Tier-1 capital is well above RBI’s requirement. This suggests that it is financially strong and has enough capital in the buffer to absorb potential losses. It has less risk of being insolvent and losing depositors’ money.

Total Deposits & Total Advances

Deposits and Advance

ICICI Bank’s total deposits show an increasing trend and grew at a CAGR of 17.37%. Its current account deposits grew by 15.83%, savings account deposits by 15.69%, and term deposits by 19.14%. It is observed that term deposits grew at a higher rate as compared to the current account and savings account deposits. This is one of the major reasons why ICICI bank’s CASA ratio has declined over five years.

It is important to analyze who the bank is issuing loans to. If a bank’s management makes poor decisions, then there is a high chance of non-performing assets. Over the past years, one reason why NPAs of Indian banks increased is because of huge corporate frauds and scams.

The graph indicates that ICICI Bank’s advances are diversified. It is also observed that the percentage of overseas loans and corporate loans has decreased over five years. Retail lending, rural loans, and business banking have increased.

According to news reports, former ICICI Bank CEO and MD Chanda Kochhar and her husband Deepak Kochhar was arrested by the Central Bureau of Investigation (CBI) in December 2022 in connection with alleged cheating and irregularities in loans sanctioned by ICICI Bank to Videocon Group companies. Chanda Kocchar quit ICICI Bank in October 2018.

Mr. Sandeep Bakhshi is the Managing Director and CEO of ICICI Bank since October 15, 2018. He has been with the ICICI Group since 1986 and has handled various assignments across the group in ICICI Limited, ICICI Lombard General Insurance, ICICI Bank, and ICICI Prudential Life Insurance.

Revenue & Profitability

Year 2018 2019 2020 2021 2022
Total Income (₹ in Crores) 118969.1 131306.5 149786.1 161192.19 157536.32
Profit (₹ in Crores) 9099.54 5689.16 11225.47 20219.68 25783.83
Net Profit Margin 14.64 % 7.9 % 13.23 % 22.68 % 27.03 %

ICICI Bank’s total revenue and profitability show an increasing trend over five years. Its revenue grew at a four-year CAGR of 11.3 % and Net profit at 34.33%. In addition, its net profit margin shows an increasing trend, which is a good sign.

ICICI Bank – Key Metrics

Particulars Values Particulars Values
Face Value (₹) ₹2 ROE (%) 15.49
Market Cap (₹ in Cr) 6,03,957.13 Stock P/E (TTM) 20.37
EPS (₹) 42.49 Dividend Yield (%) 0.68

ICICI Bank is a large-cap bank with a market capitalization of ₹ 6,03,957.13 crores as of January 16, 2023. It has an ideal return on equity of 15.49% and a dividend yield of 0.68. Its shares were trading at a price-to-earnings ratio of 20.88, which is significantly higher than the industry P/E of 9.79, indicating that the stock might be overvalued as compared to its peers. It could also mean that investors are willing to pay a higher price for the company’s future earnings.

In Closing

In this article, we did a quick fundamental analysis of ICICI Bank. We took a look at the bank’s business and the industry overview. Then we went through important metrics that are relevant to banking companies and then we looked at the bank’s revenue, profitability, and other key metrics. That’s all for this article, folks. We hope to see you around and happy investing until next time.

You can now get the latest updates in the stock market on Trade Brains News and you can also use our Trade Brains Stock Screener to find the best stocks.

The post Fundamental Analysis of ICICI Bank – Company, Financials & More appeared first on Trade Brains.

Via

https://ift.tt/9d5oEwy

Adani Power Vs Tata Power – Profitability, Future Prospects & More!

Adani Power vs Tata Power - Cover Image

Adani Power Vs Tata Power: With great power come great electricity bills! Believe it or not, this week we saw a few things that we cannot forget. For starters, people were roasting chapattis on footpaths. Then, we saw a ‘jaggeryfall’ right inside a jaggery shop. And then, everyone covered their faces with a stole, to an extent that they were unrecognizable.

What’s happening, you wonder? Well, it’s the heat wave. The early onset of summer and the heatwave led to discomfort. As a result, the usage of air conditioners, fans, and coolers increased. So did the demand for power.

Well, let’s not talk about bills. Instead, we’ll compare Adani Power Vs Tata Power, that whip up the electricity. We’ll compare them based on their business, profits, prospects, and more! Let’s dive (right) in, shall we?

Industry Overview

Electricity is a very important part of the infrastructure of any country. Economic activities are no longer limited to daylight. Countries try to ensure affordable and uninterrupted power supply to everyone.

India is the third-largest consumer and producer of electricity in the world. However, the per capita consumption is less than a third of the global average. Therefore, power companies like Adani Power and Tata Power have a huge opportunity to tap into. Experts expect the demand for power in India to grow three-fold by 2040.

Adani Power vs Tata Power – Business Overview

Adani Power

Adani Power Logo

Adani Power is a part of the Adani Group. Currently, it is India’s largest thermal power company with a power generation capacity of 13,610 MW. Its thermal power plants are located in Gujarat, Maharashtra, Karnataka, Rajasthan, and Chhattisgarh. Further, it has a 40 MW solar power plant in Gujarat.

Adani power was the world’s first company to set up a coal-based supercritical thermal power project. It was set up in Mundra in December 2010. Moreover, this project was registered under the Clean Development Mechanism (CDM) of the Kyoto protocol. Similarly, a project in Godda, Jharkhand will export power from India to Bangladesh. The company has more than 7000 MW capacity power plants in the making. These projects are planned across Jharkhand, Madhya Pradesh, Gujarat, Rajasthan and Karnataka.

Adani Power accounts for around 6% of the capacity created in India’s multi-decade coal and lignite-based power generation sector. In addition, it accounts for 16% of all the investments made by the private sector in India’s power generation sector.

It has co-signed a power supply agreement with Madhya Pradesh Power Management Company Ltd in FY21. Its long-term power purchase agreements account for 74% of the company’s gross capacity. Further, the average life of these agreements was 18.5 years at the close of FY21.

Tata Power

Tata Power Logo

Tata Power is present across the entire power value chain. It is India’s largest integrated power company. This includes conventional & renewable energy, power services, and next-generation customer solutions including solar rooftops, EV charging stations, and home automation.

“Clean, cheap and abundant power is one the basic ingredients for the economic progress of a city, state or country.”

Sri Jamsetji Tata, Founder, Tata Group

Tata Power was the first company to set up India’s first hydroelectric power stations in 1915. It was known as Tata electric then. It has 14,076 MW of generation capacity together with its subsidiaries & joint entities. About 34% of this comes from clean energy sources.

It is among the top private players in each sector of the value chain including solar rooftops and value-added services. Further, the company manages a transmission network of 3,532 km and a distribution network of more than 400 thousand circuit km across India.

Tata Power has over a hundred years of presence in the Indian power sector. It serves over 12 million distribution customers. It is credited with steering the energy sector on technology, process, and platform. Its latest business-integrated solutions, focus on mobility and lifestyle and are poised for multi-fold growth.

Adani Power vs Tata Power – Products/ Services

In short, Adani Power generates power using thermal and solar energy. Whereas, Tata Power generates power using thermal energy. In addition, it has a considerable renewable energy portfolio. Moreover, Tata Power transmits and distributes power. Consumer-centric business, energy as a service, and power trading are a few additional businesses of Tata Power.

Adani Power vs Tata Power – Competitive Advantage

Adani Power has:

  • Pan India presence
  • Long-term power purchase agreements
  • Pioneer in ultra-supercritical and supercritical technologies
  • Strategically located plants that lead to lower expenses.

On the other hand, Tata Power has:

  • Diversified presence across the energy value chain
  • Pan India presence
  • An experienced and well-established player in the energy sector.

Risks Involved

However, the unavailability of coal and fluctuations in coal prices affect both companies.

Adani Power vs Tata Power – Impact of Covid-19

There was a marginal impact on power generation companies because they are essential services. Though the demand for electricity declined in workplaces, it increased in households.

Once the economy opened up, the demand for electricity surged. A few people started working at offices, while others continued to work from home. The revenues of both companies took a hit due to the pandemic.

Adani Power vs Tata Power – Future prospects

As mentioned earlier, India is the third-largest consumer of electricity. However, its per capita consumption is much lower than the global average. But, the government’s ‘Power for All initiative aims to make India a manufacturing hub. As a result, the sector will flourish.

Adani Power is focusing on increasing its capacity across new and existing plants to capture the rising demand. Similarly, Tata Power is foraying into renewable energy and is aggressively increasing its renewable energy portfolio.

Growth with Goodness – Sustainability Efforts

Adani Power

Adani Power entered the sector only in 2006. However, it has remained resilient and has grown stronger. It empowers communities with well-defined human development goals. The company is committed to growth with goodness.

Adani Power has emerged as the leader in India’s electric utility sector on ESG benchmarking for the year 2019 conducted by S&P Dow Jones Indices and SAM. Here’s a little more about Adani Power’s sustainability efforts:

  • Their coastal locations use seawater. In addition, they use recycled and reused water for ash handling and dust suppression. Further, they have implemented rainwater harvesting in their hinterland plants.
  • Their team tries to understand the needs of local communities. These needs may be in areas of education, health, livelihood, and infrastructure development.
  • They have a system to receive and address grievances of local communities at operating locations.
  • They try their best to minimize any negative impact on biodiversity and ecosystem services. Ecosystem services include forests, grasslands, mangroves, and urban areas.
  • The company undertook large-scale plantations in and around our power plants and office locations.
  • They dispose of hazardous waste through authorized agencies as per the Hazardous Waste Handling and Management Rules.
  • Their emissions are well within emission standards.
  • Supercritical boilers help them to save about 2% of fuel per unit. Thereby, they lead to a reduction in greenhouse per unit.

Tata Power

Tata Power tackles the issues of Climate Change by adopting sustainable and responsible growth. They have developed a holistic sustainability model. It includes the environment, community, customers, and people.

  • The company currently has a 30% clean energy portfolio, but it is aiming to have a 40-50% clean energy portfolio by 2025.
  • The health and safety of all employees and other stakeholders are its priority. Therefore, it is proactively driving the health and safety agenda through the length and breadth of the company.
  • PPC, fly ash bricks and road embankment constructions use the ash produced by its thermal power plants.
  • Tata Power educates its employees on the importance of proper management of E-Waste. Further, it looks out for possibilities for extending the usable life of things and minimizing e-waste generation.
  • Tata Power has a strategic intent to be water-neutral by 2035. Therefore it is committed to water conservation and management.
  • The company identifies risks and promotes a proactive approach to treating them. Further, it has allocated adequate resources to mitigate and manage risks.

Adani Power Vs Tata Power – Revenue Growth

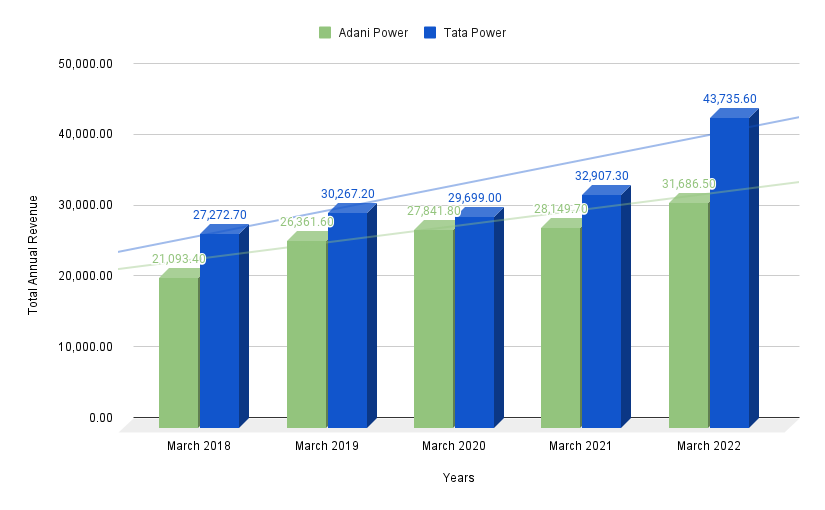
Adani Power Vs Tata Power - Revenue

The revenues of both Adani Power and Tata Power show an increasing trend. Adani Power’s total revenue grew at a compounded annual growth rate (CAGR) of 6.3% in the last three years and 6.5% in the last five years.

On the other hand, Tata Power’s total revenue grew at a CAGR of 13.1% in the last three years and 9.2% in the last five years. In other words, it grew at a faster pace as compared to Adani Power.

The top private players didn’t see strong growth in their revenues despite the under penetration of power in India. This was mainly because of a slowdown in economic growth.

Adani Power Vs Tata Power – Profitability

Adani Power Vs Tata Power - Profitability

Adani Power’s profitability was negative from 2018 to 2020. However, the company reported a steep rise in profits. Its profits were much higher than Tata Power over the last two years.

Currently, its profit shows an increasing trend. Adani Power’s profits were negative before 2021 because of interest expenses on its debts. However, in the last two years, its net profits increased led by lower costs of imported coal.

On the other hand, Tata Power has been profitable over the last five years. However, its profits show a declining trend. The strong performance of Tata Power’s EPC business and lower interest costs due to debt repayment have helped the company to maintain a positive net margin. Tata Power’s net margin has declined from 3.93% in 2018 to 0.49% in 2022, but it has remained positive.

Adani Power Vs Tata Power – Key Metrics

Particulars Adani Power Tata Power
Face Value (₹) 10 1
EPS (₹) 26.8 7.96
ROE (%) 370 8.42
Current Ratio 0.95 0.80
Market Cap (Cr) 113,703 67,533
Promoter’s Holdings (%) 74.97 46.86
Dividend Yield (%) 0 0.83
Stock P/E (TTM) 11 26.6
Net Profit Margin 17.9 5.27

Adani Power has a higher revenue growth as compared to Tata Power, indicating better operational efficiency. It has long-term power purchase agreements with its customers, hence it wasn’t impacted much during the economic slowdown.

Adani Power has long-term borrowings of ₹ 37,871.32 crores. On the other hand, Tata Power has total borrowings of ₹32,729.70 crores.

Both companies have a low current ratio. This indicates that they have difficulty paying their immediate debts and liabilities.

Is Tata Power better than Adani Power?

Tata Power triumphs with Adani Power on parameters such as backward integration, price-to-book value ratio, dividend yield and more. However, Adani Power has been a growth stock despite being in a slow-growth industry. It has grown multi-fold over the past few years. This puts Adani Power in a sweet spot over Tata Power, which has not grown much. Thus we can say that Adani Power is better than Tata Power from a growth perspective.

In Closing

In this article, we compared Adani Power Vs Tata Power. We understood their business and the industry that they are working in. Then we took a look at the impact of Covid on the companies and their future prospect. Later, we understood what they do to keep their business sustainable. And finally, we compared them on the basis of key metrics like revenue, profitability and financial ratios. That’s all for today’s article, folks.

We hope to see you around and happy investing, until next time!

You can now get the latest updates in the stock market on Trade Brains News and you can even use our Trade Brains Portal for fundamental analysis of your favorite stocks.

The post Adani Power Vs Tata Power – Profitability, Future Prospects & More! appeared first on Trade Brains.

Via

https://ift.tt/9d5oEwy

Fundamental Analysis of Adani Transmission – Future Plans & More

Fundamental Analysis of Adani Transmission - Cover Image

Fundamental Analysis of Adani Transmission: Yes, it is true that the Adani Group is a well-diversified conglomerate. Be it green energy, city gas distribution, or simply power generation, the Adani Group has its hands in all cookie jars. But did you know that the energy sector lies at the core of Gautam Adani’s business empire?

But did you also know that Adani Transmission? brings electricity to your home? Yes, you read that right. In this article, we will conduct a fundamental analysis of Adani Transmission.

Fundamental Analysis of Adani Transmission

Today we will cover the company history, financials, and future plans and also conduct a detailed Fundamental Analysis of Adani Transmission.

Company History

Part of the ports to power conglomerate the Adani Group, Adani Transmission. (ATL) traces its origins back to 2006. A 220 KV transmission line was developed for Mundra Thermal Power Station.

Then over the years, the transmission business saw expansion as part of Adani Enterprises. The company was subsequently demerged and listed as Adani Transmission. in 2015. The rest is history.

Today, Ahmedabad, Gujarat-headquartered ATL is one of India’s largest private sector power transmission companies. It establishes, commissions, operates, and maintains electric power transmission systems.

The company owns a portfolio of over 18,795 ckm of transmission lines and 40,001 MVA of power transformation capacity from 132 to 765 KV of HVAC systems and +/- 500 KV of HVDC systems. Additionally, ATL is also involved in the business of energy distribution through well-integrated utilities in Mumbai and Mundra SEZ area.

The image below presents the structure of Adani Transmission.

Fundamental Analysis of Adani Transmission - Business chart

It has a workforce of over 11,000 employees and a presence in 13 Indian states with its 31 transmission projects. We got a good snapshot of the history and the present state of Adani Transmission . 

Let us now move ahead to the industry overview as part of our fundamental analysis of Adani Transmission .

Industry Overview

India is the third-largest producer and second-largest consumer of electricity in the world. The nation has a total installed capacity of 395.6 GW. The power so generated is then transferred through the transmission systems run by transmission companies.

India’s transmission infrastructure has always lagged behind its power generation capabilities. Thus, there is an extra focus to streamline energy transmission operations with the country’s production capacity.

As of 31 December 2021, India’s transmission line capacity stood at 4.56 lacs circuit kilometers (ckm) and inter-regional power transfer capacity at 1,12,250 MW. As per the data from National Power Portal, the nation grew its transmission capacity at a CAGR of 6% from 3,20,000 ckm in 2016 to 4,56,716 ckm in 2022.

Similarly, the transformation capacity increased from 8,26,958 MVA to 10,79,766 MVA during the same period. 

The figure below offers a perspective on the growth in transmission lines and transformation capacity in India.

Fundamental Analysis of Adani Transmission - Growth

Going forward, growth in renewable energy production is directly expected to help India’s power transmission industry. The reason behind this is that the substantial renewable energy resources are unevenly distributed in the country.

This demands the need for grid digitalization and broadening of the national transmission network as the country prepares for the green energy shift. 

Thus, rising income levels, increased energy consumption, growing population, renewable energy growth, green energy transmission highways/corridors, urbanization, and smart metering are expected to bring growth to India’s power transmission and distribution industry.  

Fundamental Analysis Adani Transmission – Financials

Fundamental Analysis of Adani Transmission - Financials

Revenue & Net-Profit Growth

ATL has grown organically and inorganically over the years as and when the management came across attractive opportunities. For instance, ATL acquired the power distribution business of Reliance Infrastructure Limited in Mumbai in 2018. In 2020 and 2021, it purchased assets of Kalapataru Power Transmission, Maharashtra State Electricity Transmission Company, and Essel Infraprojects. 

Against the industry growth of 6% annually from 2016 to 2022, ATL grew at a CAGR of 18% every year. Its revenues increased at a CAGR of 23.34% in the last five years. However, during the same period, the profitability of the company declined sharply on account of higher interest charges.

From FY2019, the company took more debt to fund its purchases, with profit margins taking a hit.

The table below shows the revenue, net profit, and margin figures of Adani Transmission for the last five years.

Year Revenue (Rs. Cr.) Net Profit (Rs. Cr.) NPM (%) OPM (%)
2022 11,258 1,236 11 37
2021 9,926 1,290 13 40
2020 11,416 706 6 37
2019 7,305 559 8 38
2018 3,944 1,143 29 72

Debt & Interest Coverage Ratio

Adani Transmission operates in the electricity transmission business in which state and central power distribution companies serve as counterparties to the company. These partnerships are stable in nature and offer strong revenue stability and visibility. 

Thus, the confidence in revenues has allowed the management to pile more debt to fund its acquisitions and organic expansion. Nevertheless, with the debt to equity ratio of 4.35 and a low-interest coverage ratio of 2.03, the company is over-leveraged. 

However, with no default history and strong parentage, the company still has a rating above junk grade at BBB- / Baa3. 

Year Debt/Equity Interest Coverage
2022 4.35 2.03
2021 4.23 1.49
2020 4.51 1.6
2019 3.87 1.54
2018 2.28 2.66

Adani TransmissionFuture Plans

We looked at the past five years’ numbers of the company. While all that is good, it provokes the question, “What’s ahead?”

  1. As of 31 March 2022, ATL had a 20,765 MVA of power transformation capacity under construction including a portfolio of 4,516 km of power transmission lines. It accounts for Rs. 18,000 directed towards the construction of 10 transmission projects including 1 HVDC project.
  2. Adani Electricity Mumbai Limited (AEML), a subsidiary of ATL for the purpose of distributing electricity in Mumbai has in place a fully-funded CAPEX plan of Rs. 8,100 crores during the FY23-26 period.
Investor Presentation
  1. The company has eyed Identified tariff-based competitive bidding opportunities worth Rs. 52,000 crores in the near term out of which Rs. 13,400 crores are under RFP/RFQ stage.
  2. The privatization of energy distribution along with smart metering has opened up a market of Rs. 2.2 lakh crore for the distribution segment of the Adani Transmission. The management will take adequate expansion steps as and when the right investment avenues are available.

Adani Transmission – Key Metrics

We are almost at the end of our fundamental analysis of Adani Transmission Ltd. Let us have a quick look at its key metrics.

CMP (Rs.) 1,611 Market Cap (Rs. Cr.) 224180
Stock P/E 481 Face Value (Rs.) 10.0
ROCE 12% Book Value (Rs.) 62.4
ROE 19% Price to Book Value 64.8
Debt to Equity 4.36 Promoter Holding 73.9%
Net Profit Margin 11% Operating Profit Margin 37%
Interest Coverage Ratio 2.03 Dividend Yield 0.0%

In Conclusion

As we finish our fundamental analysis of Adani Transmission, we can settle down on the two points. In a matter of two years, the stock of Adani Transmission has given an eye-popping return of 1,455%. And that’s a lot. 

Going forward, will it be able to sustain its momentum? It entirely depends on the ability of the company to grow at the same pace. But as the saying goes, “Trees don’t grow to the sky.”

Thus, we may not see the same multi-bagger returns in the future. Do you think there is still steam left in Adani Transmission? How about you enlighten us with your perspective on ATL in the comments below?

You can now get the latest updates in the stock market on Trade Brains News and you can even use our Trade Brains Portal for fundamental analysis of your favorite stocks.

The post Fundamental Analysis of Adani Transmission – Future Plans & More appeared first on Trade Brains.

Via

https://ift.tt/9d5oEwy

Sunday, January 29, 2023

Fundamental Analysis of Olectra Greentech

Fundamental Analysis of Olectra Greentech - Cover Image

Fundamental Analysis of Olectra Greentech: The electric vehicle (EV) push in India opens a plethora of business opportunities across mobility, infrastructure, and energy. Businesses like charging stations, battery recycling, EV manufacturing, and many more have gained momentum in the past few years. EVs have lower running costs, tax and financial benefits, are easy to drive and quiet, have a spacious cabin and more storage, and do not emit pollutants.

Globally, people are increasingly adopting EVs in place of traditional vehicles. Many companies have scaled their business and this brings an opportunity for investors, especially those who want to remain invested in stocks for a period of more than five to ten years. One such company that comes to mind is Olectra Greentech. In this article, we shall do a fundamental analysis of Olectra Greentech. We’ll take a look at its business, industry, competitors, and more.

About the Company

Olectra Greentech logo

Olectra Greentech Limited is India’s largest Pure Electric Bus Manufacturer, headquartered in Hyderabad. It manufactures composite polymer insulators and electrical buses. After finding success in the electric bus industry, the company is expanding its product line in the e-mobility segment for 3-wheeler electric autos and electric trucks.

Manufacturing

The company manufactures seven-meter, nine-meter, and twelve-meter models of air-conditioned electric buses in India. It has manufacturing facilities located in Hyderabad with a manufacturing capacity of 1500 units per year. In fact, it was one of the largest manufacturers of e-buses in India during H1FY23 (first half of FY23). The Company has a cooperation agreement with BYD Auto Industry Co Ltd, for the assembly, manufacture, sales, marketing, and after-sales service of Electric Buses in India.

Order Book

The company has a healthy order book for supplying 3328 E-buses as of June 2022, out of which 1,125 E-buses orders are received under the FAME II scheme. These buses are to be supplied over a period of 12-15 months. The order book also includes 2100 buses worth ~Rs. 3675 crore from Brihanmumbai Electric Supply and Transport Undertaking (BEST) which is currently under litigation. Further, it bagged an order for supplying 100 electric buses worth ₹ 151 crores to the Assam State Transport Corporation, in September 2022. The buses will be delivered over a period of nine months, and maintenance will be taken care of for the next five years by Olectra Greentech.

Competitors

Traditional players are already in the market, however, new players are gaining a higher market share. Olectra Greentech has consistently been in the top three players in terms of market share. It has a market share of 28% followed by Ashok Leyland/Switch Mobility (16%), JBM Auto (15%), PMI Electro Mobility (28%), Tata Motors (11%), and others (1%, as of H1FY2023), as far as e-buses are concerned.

Industry Overview

The penetration of e-buses is less than 10% in most countries, except for China, which has a penetration of 26%. In India, the penetration of e-buses is 4%, with over 1176 buses sold. The penetration of e-buses is increasing across markets on the back of stricter climate controls.

EV Mobility

Electric Vehicle (EV) Mobility has a major role in shaping the auto industry in the near future. The Indian automobile industry is the fifth largest in the world and is slated to become the third largest by 2030. As per India Energy Storage Alliance (IESA), the Indian EV industry is expected to expand at a CAGR of 36%. India imports close to 80% of its crude oil requirements. Therefore, the demand for EVs will be on the rise, as the demographics change. India’s think tank, the NITI Aayog aims to achieve EV sales penetration of 70% for all commercial cars, 30% for private cars, 40% for buses, and 80% for two and three-wheelers by 2030. This is in line with the goal to achieve net zero carbon emissions by 2070.

Insulators

India is the third-largest producer and second-largest consumer of electricity in the world. As far as insulators are concerned, the Indian energy market is expected to grow at a Compound Annual Growth Rate(CAGR) of more than 3% during the period of 2022- 2027. Factors such as population growth in India are a strong propeller for the power market. Urbanization in the country will also have significant implications on the trend of energy consumption because of the increase in demand from industries that use energy for construction and manufacturing.

Government Initiatives

The government of India has been at the forefront of framing policies related to EV adoption in the country.

FAME India Scheme

The government had allocated ₹ 895 crores under FAME (Faster Adoption and Manufacturing of Hybrid and Electric Vehicles). This investment was increased to a whopping ₹ 10,000 crores in FAME-II. Another support policy is an outlay of ₹ 105 crores for the purchase of electric vehicles for mass transportation, under the Smart Cities Mission 2015. Higher subsidies of 35 to 55 lakh per bus and a subsidy cap of 40% of the vehicle cost will help to adopt e-buses under FAME 2.

PLI Scheme & Battery Swapping Policy

The government introduced the Production Linked Incentive (PLI) for Advanced Chemistry Cell Battery Storage (PLI-ACC) scheme. In addition, it has a battery-swapping policy in place. Battery swapping involves exchanging discharged batteries for charged ones. This solves the problem of charging vehicles periodically and helps to cover longer distances.

Olectra Greentech – Financials

Revenue & Profitability

Fundamental Analysis of Olectra Greentech - Financials
Year 2018 2019 2020 2021 2022
Revenue (₹ in Crores) ₹161.49 ₹170.11 ₹200.52 ₹281.38 ₹593.26
Profit (₹ in Crores) ₹8.89 -₹15.81 ₹13.53 ₹8.07 ₹35.36
Net Profit Margin 5.51 % – 9.3 % 6.75 % 2.87 % 5.96 %

The company’s revenue, as well as profits, show an increasing trend. Its sales grew at a 3-year CAGR of 51.65%. In addition, its net profit margin has been showing an increasing trend. It grew from 5.51% in the financial year 2017-18 to 5.96% in the financial year 2021-22.

The company in FY22 derived 82% of its revenue from Electric Buses and 18% from composite polymer insulators. A major concentration risk that the company faces is that its top two or three customers account for more than 50% of its revenue as of March 2022.

Fundamental Analysis Of Olectra Greentech – Key Metrics

Particulars Values Particulars Values
Face Value (₹) 4 ROE (%) 4.66
Market Cap (₹ in Cr) 4,398.71 Net Profit Margin 5.96%
EPS (₹) 6.66 Current Ratio 2.37
Stock P/E (TTM) 80.29 Debt to Equity 0.09
Dividend Yield (%) 0.06 Promoter’s Holdings (%) 50.02

Olectra Greentech is a small-cap company with a market capitalization of ₹ 4,398.71 crores as of December 2022. It has earnings per share of ₹ 6.66, indicating that ₹ 6.66 is allocated to every individual share of the stock. A high EPS indicates good profitability. Its shares were trading at a price-to-equity ratio (P/E) of 80.29 which is significantly higher than the industry P/E of 40.03. This could mean that the company’s stock is overvalued as compared to its peers.

Return Ratios

The company has a poor return on equity of 4.66%. This indicates that the company generates a good amount of profit on the equity that is employed in it. Further, it has a return on capital employed of 7.73%, indicating that it generates ₹ 7.73 for every ₹ 100 that is deployed in its business.

Debt & Liquidity Ratios

Olectra Greentech has an ideal debt-to-equity ratio of 0.09. Further, it has a current ratio of 2.37. This indicates that its current assets are more than twice its current liabilities. It has a dividend yield of 0.06. The company has a credit rating of BBB+ positive outlook from ICRA, and a BBB+ stable outlook from IND ratings.

Shareholding

The company’s promoters hold a 51.74% stake in it. Retail investors hold a 39.54% stake, FIIs hold 10.41% and DIIs hold 0.03%. Further, there is no pledge against the promoters’ holding. The promoters’ stake has decreased from 51.75% in September 2021 to 50.02% in September 2022. However, FIIs have increased their stake in the company from 8.65% to 10.41% during the same period. This is a positive sign.

Future Plans of Olectra Greentech

The company is setting up a new greenfield plant with a capacity of 5,000 units per year and scalable up to 10,000 units per year. It has acquired 150 acres of land in Hyderabad for this purpose. The new plant will result in an expanded capacity of 5,000 electric vehicles per year, scalable up to 10,000 electric vehicles per year. The company has started trials of the E-tipper which is expected to be launched in the near future. It plans to enter into staff transport and is already working on strengthening the inter-city/ inter-state private transport segment. It plans to establish TARMAC buses in airports.

In Closing

In this article on the fundamental analysis of Olectra Greentech, we took a look at the company’s business, the industry that its functions, and its competitors. Later we took a look at financial metrics like revenue, profitability, ratios, and shareholding. That’s all for this article folks. We hope to see you around and happy investing until next time.

You can now get the latest updates in the stock market on Trade Brains News and you can also use our Trade Brains Screener to find the best stocks.

The post Fundamental Analysis of Olectra Greentech appeared first on Trade Brains.

Via

https://ift.tt/9d5oEwy

Wednesday, January 25, 2023

Top Sugar Penny Stocks in India 2023 – Add To Your Watchlist

Top Sugar Penny Stocks in India - Cover Image

Top Sugar Penny Stocks in India: Sugar has long been considered a cyclical industry in India. However, in the past few years, the government’s push for ethanol blending and the export quotas raise has turned the fortunes of the companies in the sector. Being a commodity, the smallest companies are well-positioned as much as their larger peers. In this article, we’ll look at such small sugar manufacturers, aka, top penny sugar stocks in India.

Top Sugar Penny Stocks in India

The sugar sector is a capital-intensive industry involving huge leverage. Many producers have to keep significant debt in their capital structure. Additionally, the manufacturers enjoy an entry barrier because of their local brand awareness and sourcing ties. 

Thus, with operational and financial leverage involved, sugar stocks become all the way more attractive with record sugar cane production, exports increase, and ethanol blending targets. 

These leverage metrics are more pronounced in small companies, the holy grail of multi-bagger returns. Therefore, we take a closer look at the top sugar penny stocks in India. So without further ado, let us jump in.

Top Sugar Penny Stocks #1 – Indian Sucrose

Top Sugar Penny Stocks in India - Indian Sucrose logo
CMP ₹63 Market Cap (Cr.) ₹109
EPS ₹14.0 Stock P/E 4.59
RoCE 18.4% RoE 28.4%
Promoter Holding 64.5% Book Value ₹87.8
Debt to Equity 1.61 Price to Book Value 0.71
Net Profit Margin 8.4% Operating Profit Margin 13.3%

Indian Sucrose Ltd. (ISL) is a Punjab-based sugar manufacturing company engaged in the production of sugar, molasses, bagasse & other products and captive power generation. It operates one plant in the Hoshiarpur district of Punjab. 

ISL was started in 1990. As of the present date, the company has an installed capacity of 9000 tonnes of cane per day (TCD) and a co-generation power capacity of 30 MW. 

Sugar production accounted for 90% of the total operating income of Indian Sucrose in FY22. Its net profit has steadily increased from Rs 19 crore in FY20 to Rs 40 crore in FY22 as the operating margins improved during the period.

ISL presently trades an attractive price-to-earnings ratio of 4.59 and a price-to-book value of 0.71. The stock is highly leveraged with a debt-to-equity ratio of 1.61. This translates into a wide gap in the return ratios with RoCE at 18.4% and RoE at 28.4%.

Top Sugar Penny Stocks #2 – KM Sugar Mills

Top Sugar Penny Stocks in India - Km Sugar Mills
CMP ₹30 Market Cap (Cr.) ₹279
EPS ₹2.09 Stock P/E 14.6
RoCE 15.2% RoE 17.9%
Promoter Holding 56.5% Book Value ₹27.9
Debt to Equity 0.88 Price to Book Value 1.09
Net Profit Margin 7.59% Operating Profit Margin 13.40%

Located in Faizabad, Uttar Pradesh, KM Sugar Mills is engaged in the business of producing sugar, distillery products, and power. Its sugar plant manufacturing capacity stands at 9000 TCD. Additionally, its distillery plant and co-generation power installed capacity are 45-KPD and 25 MW respectively.

Its bagasse-based co-generation energy plant is connected to the grid. Thus, the company supplies electricity to the Uttar Pradesh Power Corporation. 

Like Indian Sucrose, sugar production for KM Sugar contributed to a majority of 89% of the company’s operating sales. This was followed by the distillery division’s share of 8%. 

KM Sugar Mills reported a net profit of Rs 41 crore in FY22 on sales of Rs 548 crore. The net profit has increased by 128% in two years from Rs 18 crore only in FY10. 

Top Sugar Penny Stocks #3 – Vishwaraj Sugar Industries

Top Sugar Penny Stocks in India - Vishwaraj Sugar Logo
CMP ₹18 Market Cap (Cr.) ₹337
EPS ₹2.75 Stock P/E 6.5
RoCE 12.7% RoE 23.7%
Promoter Holding 33.7% Book Value ₹14.3
Debt to Equity 0.89 Price to Book Value 1.29
Net Profit Margin 12.9% Operating Profit Margin 20.0%

Incorporated in 1995, Vishwaraj Sugar Industries Ltd. is a small-cap producer of sugar, molasses, and captive power. Its manufacturing facility is located in Belgaum, Karnataka which has been categorized as a high sugar recovery zone by the Indian government.

The company also manufactures rectified spirit, ENA, ethanol, vinegar, press mud, and compost. Its present installed sugarcane crushing capacity stands at 10,500 TCD. It supplies its sugar for domestic as well as industrial consumption (or manufacturing biscuits, confectionery, and beverages).

The sugar segment brought 58% of Vishwaraj Sugar’s total operating revenue of Rs 468 crore in FY22. Unlike the previous two stocks we covered above, its distillery segment contributed to a major 32% of the operating income.

The sugar penny stock currently trades at a lucrative P/E ratio of 6.5. Its debt-to-equity ratio stands at 0.89. It has a relatively lower promoter shareholding of 33.7%. 

Top Sugar Penny Stocks #4 – Kothari Sugars & Chemicals

Kothari Sugars logo
CMP ₹44 Market Cap (Cr.) ₹366
EPS ₹5.41 Stock P/E 7.9
RoCE 16.80% RoE 16.20%
Promoter Holding 73.5% Book Value ₹29.6
Debt to Equity 0.23 Price to Book Value 1.48
Net Profit Margin 7.8% Operating Profit Margin 11.8%

Part of the HC Kothari Group, Kothari Sugars and Chemicals was set up as a sugar mill in 1961 in Trichy, Tamil Nadu. Fast forward to today, the company runs two sugar manufacturing plants and also produces captive power, industrial alcohol, and bio-compost.

In FY22, Kothari Sugars earned operating revenue of Rs 422 crore. Sugar production accounted for a majority of 62% of the sales of this sugar penny stock. Co-generation of power and distillery products contributed to 26% and 25% of the income respectively.

The revenues of the company have steadily increased from Rs 287 crore in FY18 to Rs 422 crore in FY22 at a CAGR of 8.01% every year. It reported a net profit of Rs 34 crore in the recent financial year.

The shares of Kothari Sugars and Chemicals presently trade at a price-to-earnings ratio of 7.9 and a price-to-book value ratio of 1.48. Unlike other leveraged sugar manufacturers in this list, it has a low debt with a debt-to-equity ratio of 0.23.

Top Sugar Penny Stocks #5 – Piccadily Agro Industries

CMP ₹44 Market Cap (Cr.) ₹411
EPS ₹2.01 Stock P/E 21.7
RoCE 17.0% RoE 14.9%
Promoter Holding 71% Book Value ₹23
Debt to Equity 0.59 Price to Book Value 1.90
Net Profit Margin 5.1% Operating Profit Margin 12.1%

Piccadilly Agro Industries Ltd. (PAIL) is a Haryana-based small-cap manufacturer of white crystal sugar with an installed capacity of 5,000 TCD. Additionally, it has a co-generation power capacity of 6 MW and a distillery capacity of 60 KLPD. 

The company was incorporated in 1994 and presently runs as a group with its 3 associate companies. Its two segments: sugar and distillery contributed to 54% and 46% of the total operating revenue in FY22.

The top line of this sugar penny stock has consistently increased from Rs 334 crore in FY18 to Rs 572 crore in FY22. In the recent fiscal, it earned a net profit of Rs 29 crore. 

Piccadilly Agro has a high promoter holding of 71%. Its stock presently trades at a P/E ratio of 21.7 giving the company a market cap of Rs 411 crore.   

List of Top Sugar Penny Stocks in India

The table below lists all the sugar penny stocks we covered above.

Company Name CMP (Rs) Market Cap (Rs Cr) P/E FY22 Sales (Rs Cr)
Indian Sucrose 63 109 4.6 443
KM Sugar Mills 30 279 14.6 548
Vishwaraj Sugar Industries 18 337 6.5 467
Kothari Sugars & Chemicals 44 366 7.9 422
Piccadily Agro Industries 44 411 21.7 572

In Conclusion

We are now at the end of our article on the top sugar penny stocks in India. We observed that the revenue sources of the larger penny stocks are more diversified than the smallest companies. Further, they have comparatively lower debt-to-equity ratios. However, investors must exercise due diligence before investing in penny stocks. 

Many are part of pump-and-dump strategies. Or their liquidity evaporates at the first sign of trouble. How comfortable are you with penny stocks? Which penny stocks would you like us to cover next? Feel free to comment below.

You can now get the latest updates in the stock market on Trade Brains News and you can also use our Trade Brains Screener to find the best stocks.

The post Top Sugar Penny Stocks in India 2023 – Add To Your Watchlist appeared first on Trade Brains.

Via

https://ift.tt/mFqiYyS

Tuesday, January 24, 2023

Fundamental Analysis of Suzlon Energy – Financials, Key Metrics & More

Fundamental Analysis of Suzlon Energy - Cover Image

Fundamental Analysis of Suzlon Energy: Suzlon Energy may as well be one of the most talked about companies. An industry leader, it is not the only positive news that keeps it in the headlines. It is also heavy losses, piling debt, and whatnot. What makes it so attractive that investors want to own it despite its problems? Let us find out by performing a fundamental analysis of Suzlon Energy.

Fundamental Analysis of Suzlon Energy

In this article, we shall attempt to conduct a fundamental analysis of Suzlon Energy. We’ll start by knowing its history, business, and past troubles. At the same time, we’ll acquaint ourselves with the industry. Next, a few sections cover the messy financials of the company with a focus on data points pointing to a recovery. A summary concludes the article in the end.

Company Overview

Suzlon Energy traces its origins to 1994 when Tulsi R Tanti, an engineering graduate purchased two wind turbines to fulfill the energy needs of his family’s textile business. Sensing a business opportunity, one year later, he started Suzlon to provide complete wind energy solutions.

Over the years the company has emerged as one of the most vertically integrated wind turbine manufacturers globally. It has a presence in 17 nations across the globe.

Suzlon primarily manufactures and sells wind turbine generators (including project execution and sale/sub-lease of land), forging and foundry components, and provides operation & maintenance activities.

As for the share of the different revenue streams, the sale of wind turbine generators generated 67% of the sales in FY22. This was followed by the operation and maintenance services division’s contribution of 28%. The sale of components generated Rs 477 crore or 7% of the total revenue.

Having been there for so long, Suzlon must be a wind energy behemoth by now. It was once among the top 5 wind turbine manufacturers globally but things didn’t turn out as planned.

Read ahead to find out.

Huge Losses and Debt Resolution of Suzlon Energy

Despite being a pioneer in the wind energy industry, it has not been a smooth journey for the company and Tulsi Tanti. The business ran into financial troubles as it incurred more and more debt to finance its operations and acquisitions. Most of this debt was acquired before the global financial crisis hit in 2008.

Post-2008, the losses kept mounting pushing the company to bankruptcy. On multiple occasions, its debt resolution plans fell apart due to a valuation mismatch.

The management sold off its non-core assets a few times in the past to pare its debt. 

In addition to this, as part of its debt restructuring, in the present fiscal year, Rural Electrification Corporation (REC) and IREDA acquired and refinanced Rs 3,000 crore of debt. The management believes the new financiers have a background in the power industry and are better equipped to understand the business operations.

Along with this, a 16-bank consortium led by the State Bank of India took over a 5% stake in Suzlon Energy for the balance of Rs 3,500 defaulted loans.

Furthermore, the company recently raised Rs 1,200 crore through a rights issue which was oversubscribed by 1.8 times, highlighting the renewed faith of the investors in the company.

With all these developments, it appears that Suzlon has put behind its financial troubles and is off to a fresh start.

So far we have read about the history, business, and struggles of the company as part of our fundamental analysis of Suzlon Energy. In the next section, we take a look at the wind energy industry landscape.

Industry Overview

The demand for wind turbine generators is directly dependent on the growth of the wind energy industry. In this section, we’ll get acquainted with the global wind energy market and then the Indian wind energy market.

Global Wind Energy Market 

As per the data from Global Wind Energy Council, wind energy is estimated to account for 24% of the total electricity generated globally by 2030. For this to happen, the sector has to grow 4 times from the present levels.

In the calendar year 2021, 93.6GW of wind power capacity was installed worldwide taking the total capacity to 837 GW, a 12.4% increase. China, the USA, Brazil, Vietnam, and the UK were the top five countries leading the capacity installations.

Source: Suzlon Energy Ltd. Annual Report FY 2022-21 

As for industry growth, the wind energy industry has grown at a CAGR of 12% in terms of installed capacity over the previous 5 years.

Indian Wind Energy Market 

India is one of the largest energy markets worldwide. Wind energy at 40.3 GW accounted for 10% of the total installed wind power in India. The sector is projected to reach 140 GW by 2030 to fulfill growing energy demand which is expected to double by then.

The cumulative installed capacity grew by 2.8% over the last year. As for the outlook, the National Institute of Wind Energy (NIWE) has identified over 302 GW of onshore wind sites and 695.5 of onshore sites at 100 and 120-meter hub heights respectively. 

Source: Suzlon Energy Ltd. Annual Report FY 2022-21

As for resource distribution, Gujarat, Tamil Nadu, Karnataka, Maharashtra, and Rajasthan lead in terms of operational wind capacity.

Overall, the renewable wind energy sector is well poised for strong growth. This translates into a multitude of opportunities for companies in the sector.

Suzlon Energy – Financials

Revenue & Net Profit

The revenue and net profit of Suzlon Energy have been volatile over the past few years. In FY20, it registered a whopping net loss of Rs 2,684 crore.

However, the financials of the wind turbine manufacturer have gotten much better in the last two years. For instance, it reported a net profit of Rs 104 crore in FY21. In the recent year, FY22, it clocked a nominal profit before tax of Rs 40 lakh. Thus, we can come to terms with the fact that Suzlon’s turnaround has come.

The table below shows the operating revenue and the net profit/loss of the turbine manufacturer for the previous five years. 

Fiscal Year Operating revenue (Rs Cr) Net profit/loss (Rs Cr)
2022 6,581 -177
2021 3,345 104
2020 2,973 -2,684
2019 5,025 -1,537
2018 8,334 -384

We read above that Suzlon was overleveraged. Its heavy financial costs engulfed the company. But leverage is not only to be blamed. Read more on this in the next section on profit margins.

Profit Margins: Net & Operating

Like the top line and bottom line, the operating margins of Suzlon have been unstable. For a manufacturing company, it clocked low operating profit margins of around 9-10% in the best three of its five fiscals. 

In addition, the high-interest costs further negatively pulled down the net profit margin.

The table below highlights the grim operating profit margin and net profit margin of Suzlon Energy over the past five years.

Fiscal Year OPM (%) NPM (%)
2022 9.90 -2.52
2021 8.84 2.99
2020 -42.07 -90.53
2019 -5.98 -30.47
2018 9.12 -4.79

However, it is not as bad as it looks. After the debt reduction, the interest expenses declined 53.5% to Rs 735 crore in FY22 from Rs 1,581 crore in FY18. With the restructuring and capital raise, the finance cost will come down further.

Return Ratios: RoE & RoCE

We can not gain much insight from the analysis of the return ratios of the company as part of the fundamental analysis of Suzlon Energy. 

Its return on capital figures is negative because of the negative net worth of the company. As for the return on equity, it is undiscerning because of a very narrow equity base. Overall, the growth in revenue and improvement in liquidity has translated into better return ratios in the last two years.

Fiscal Year RoE RoCE
2022 23.45 -4.84
2021 10.01 -11.47
2020 NA NA
2019 NA NA
2018 NA NA

The data before FY20 is not conclusive because of huge losses and high debt resulting in skewed negative net worth of the company.

Debt/Equity & Interest Service Coverage

Over the past few years, the management of Suzlon has somewhat managed to steer the company away from insolvency and consequent liquidation. For instance, non-current liabilities came down to Rs 2,842 crore for the quarter ending September 2022 from Rs 7,921 crore in FY18.

The debt-to-equity ratio of the stock doesn’t convey this change because of a concurrent reduction in the equity base due to mounting losses. Additionally, the negative figures for debt/equity denote the negative net worth of Suzlon.

Despite this, a glimmer does appear with the interest coverage ratio, although small, turning positive in FY22 and FY21.

The table below shows the debt-to-equity ratio and interest coverage ratio of Suzlon Energy over the past five years.

Fiscal Year Debt / Equity Interest Coverage
2022 -1.79 0.90 
2021 -2.02 0.29 
2020 -1.19 -0.99 
2019 -1.36 -0.30 
2018 -1.71 0.75

^The figure is positive because the interest expense for FY18 was much more than the EBIT resulting in a positive numerator for the calculation of the interest coverage ratio.

Suzlon Energy – Key Metrics

We are almost at the end of our fundamental analysis of Suzlon Energy. Let us take a quick look at the key metrics of the stock.

CMP ₹9.80 Market Cap (Cr.) ₹11,600
EPS ₹2.06 Stock P/E 4.76
ROCE -4.84% ROE 23.5%
Face Value ₹2.0 Book Value -₹0.25
Promoter Holding 14.5% Price to Book Value NA
Debt to Equity -1.79 Dividend Yield NA
Net Profit Margin -2.52% Operating Profit Margin 9.90%

In Conclusion

In our fundamental analysis of Suzlon Energy, we found how the turnaround of the company has come. Overall, in the near future, the focus of the management will be on securing orders and their timely delivery with an added emphasis on keeping costs low. It just has to keep doing what it is doing. 

In your opinion, does the present price incorporate the future earnings already? Or is Suzlon undervalued from a turnaround standpoint? How about you let us know your thoughts in the comments below?

You can now get the latest updates in the stock market on Trade Brains News and you can also use our Trade Brains Stock Screener to find the best stocks.

The post Fundamental Analysis of Suzlon Energy – Financials, Key Metrics & More appeared first on Trade Brains.

Via

https://ift.tt/mFqiYyS