Monday, May 8, 2023

11 Most Frequently Used Trading Animals in the Share Market

Trading Animals in Stock Market - Cover Image

List of Most Frequently Used Trading Animals in the Share Market (Bull, Bear, Stags, Wolves & More): Have you watched the movie ‘The Wolf of Wall Street” starring Leonardo DiCaprio as Jordan Belfort? If yes, then have you wondered why he has been referred to as a wolf in the movie? What’s an animal doing in the stock market-based movie?

Well, Animals in the Stock Market are commonly used terminology to define specific characteristics of the type of traders or investors or market scenario. In this article, we are going to discuss 11 of such most commonly used animals in the stock market. Please read the article till the end as there are some bonuses in the last section of this post.

Trading animals in Share Market

11 Most Frequently Used Trading Animals in the Share Market

Here are the eleven most frequently used animals in the share market by stock analysts or the authors of investing books.

1. Bulls – The Optimistic

bulls and bears - Trading Animals in the Share Market

The bulls represent the investors or traders who are optimistic about the future prospects of the share market. They believe that the market will continue its upward trend. Bulls are the ones who drive the share price of companies higher.

2. Bears – The Pessimistic

Bear | Most Frequently Used Trading Animals in the Share Market

Bears are the investors or traders who are totally opposite of the bulls. They are convinced that the market is headed for a fall. Bears are pessimistic about the future aspects of the share market and believe that the market is going to be in RED. Mostly, bears are the reasons for getting the share prices lower.

Quick note: The bulls and bears are often used to describe the market condition. A bull market is a scenario when the market appears to be optimistic and climbing new highs. On the other hand, a bear market describes a market where things are not good and appears to be a long-term decline.

3. Rabbits

rabbit and turtle - Trading Animals in the Share Market

The term rabbits are used to describe those traders or investors who take a position for a very short period of time. The trading time of these traders is typically in minutes.

These types of traders are scalpers and trying to scalp profits during the day. They do not want overnight (or long-term) risk and just looking for an opportunity to make some quick bucks for the market during the day.

4. Turtles

Turtle | Most Frequently Used Trading Animals in the Share Market

The turtles are typically those investors who are slow to buy, slow to sell, and trade for the long-term time frame. They look at the long-term frame and try to make the least possible number of traders. This kind of investor does not care about short-term fluctuations and most concerned with long-term returns.

5. Pigs

“Bulls make money, bears make money, pigs get slaughtered”

pigs

These investors or traders are impatient, willing to take high risk, greedy, and emotional. The Pigs don’t do any kind of analysis and always look out for hot tips and want to make some quick bucks from the share market. Pigs are the biggest losers in the stock market.

6. Ostrich

ostrich

Ostriches are those kinds of investors who bury their heads in the sand during bad markets hoping that their portfolio won’t get severely affected.

These kinds of investors ignore negative news with an expectation that it will eventually go away and will not impact their investments. Ostrich investors believe that if they do not know how their portfolio is doing, it might somehow survive and come out alright.

7. Chickens

Chicken

Chicken refers to those investors who are fearful of the stock market and hence do not take risks. They stay away from the market risks by sticking to conservative instruments such as bonds, bank deposits, or government securities.

8. Sheeps

sheep

Sheep are those kinds of investors who stick to one investing style and do not change according to the market conditions.

They are usually the last ones to enter an uptrend and the last one to get out of a downtrend. The sheep like to be on the side of the majority (herd) and follow a guru. They are not interested to develop their own investing/trading method.

ALSO READ

9. Dogs

Dog

Dogs are those stocks that have been beaten down by the market due to their poor performance. Many financial analysts look into the dog stocks closely as they expect these stocks to recover in the upcoming days.

10. Stags – The Opportunistic

stags - Trading Animals in the Share Market

This kind of investor or traders are not really interested in a bull or bear market. They just lookout for opportunities. They are neither bullish nor bearish.

For example, Stags can be the traders who buy the share of a company during its initial public offering (IPO) and sell them when the stock is listed and trading commences. They do stag with the hope to get listing gains and hence these individuals are called stags.

11. Wolves

wolves

Wolves are powerful investors/traders who use unethical means to make money from the share market. Mostly, these wolves are involved in the scams that move the share market when it comes to light.

For example- Harshad Mehta can be considered the wolf of Dalal Street. He was charged with numerous financial crimes that took place in the Securities Scam of 1992. Similarly, the famous Hollywood movie ‘The Wolf of Wall Street’  depicted Jordan Belfort, who was convicted on charges of stock fraud in his penny stock operation and stock market manipulation.

ALSO, READ

Bonus: Few More Trading Animals

12. Lame ducks

Lame Duck

A lame-duck is a type of trader or investor who trades and ends up with a huge loss. Lame ducks have either defaulted on their debts or gone bankrupt due to the inability to cover trading losses. The phrase can be traced to the early years of commodity trading and the development of the London Stock Exchange during the mid-1700s.

13. Hawk & Dove

Hawk And Dove

Hawks and doves are terms used to describe the types of policymakers who take critical stances on different economic situations. It basically suggests the sensitivity of a policymaker is towards an economic situation.  A ‘hawk’ wants a tough stance in an economic situation, whereas a ‘dove’ wants to be easy with it.

14. Whales

Whale

These are the big investors who can move the stock price when they buy or sell in the market. You can make a lot of money if you trade alongside the right whale.

15. Sharks

Shark

Shares are those traders who are just concerned about making money. They get into the trades, make money, and exits the share market. The sharks have very little interest in big complicated methods of making money from the market.

16. Dead Cat Bounce

The dead cat bounce slang is used to refer to a temporary recovery during the bear run. Either it could mean a temporary upswing of the market in the midst of a bear run or it could refer to the particular stock behaviour.

Interestingly, this phrase has been employed from the explanation that if you throw a dead cat against a wall at a high rate of speed, it will bounce – but it is still dead.

17. Dogs of the Dow

This is a popular investing strategy where the investors select the 10 highest dividend-yielding blue-chip stocks from the Dow Jones Industrial Average (DJIA) every year. The main reason to follow the Dogs is that it presents a straightforward formula designed to perform roughly in line with the Dow. This concept was originally published by Michael O’Higgins’ in his book, “Beating the Dow,” in which he also coined the name “Dogs of the Dow.” Similar to this concept, Dogs of the Sensex is used in India.

That’s all. I hope this post on trading animals in the share market is helpful to you. Let me know what kind of trading animal you are- in the comment box. #HappyInvesting.

Stay updated on the latest Stock Market News and Corporate Actions NSE with Trade Brains Portal, while also keeping an eye on the Top Gainers Today in NSE with our Stock Heatmap feature.

The post 11 Most Frequently Used Trading Animals in the Share Market appeared first on Trade Brains.

Via

https://ift.tt/I0Em9qX

Sunday, May 7, 2023

Best Mid Cap Stocks Under Rs 100 – Complete List & Fundamentals

Best Mid Cap Stocks Under Rs 100 - Cover Image

Best Mid Cap Stocks Under Rs 100: Mid-cap stocks have characteristics somewhere in between large and small-cap stocks. They are safer and have more consistent earnings growth than small companies while growing faster than their larger counterparts at the same time.

They have established clients or customers because of their proven track record and brand name. While they may not become 3x or 4x like a penny or small-cap stock, mid-size companies can offer more than satisfactory returns when picked right. Along these lines, we present you top mid cap stocks under Rs 100.

Best Mid Cap Stocks Under Rs 100

In our article, we’ll look at the best mid cap stocks under Rs 100 from different industries including auto ancillary, banking, and more. We’ll learn about their history in brief, business models, and any recent developments. Without further ado, let us move ahead.

Best Mid Cap Stocks Under Rs 100 #1 – Samvardhana Motherson International

CMP ₹69 Market Cap (Cr.) ₹46,700
EPS ₹1.4 Stock P/E 45.7
RoCE 8.1% RoE 5.4%
Promoter Holding 68% Book Value 30.6
Debt to Equity 0.68 Price to Book Value 2.25
Net Profit Margin 1.9% Operating Profit Margin 7.1%

Samvardhana Motherson International Ltd. or SAMIL was started as Motherson Sumi Systems Ltd. (MSSL) in 1986 as a joint venture between the Motherson Group of India and Sumitomo Wiring Systems (SWS) of Japan.

MSSL grew from a single-customer company producing wiring harnesses for Maruti Udyog into a multi-product auto-ancillary company with an international presence. As of the present date, it sells vision systems, modules & polymer products, elastomers, and other auto-ancillary products.

The wiring harnesses business is no longer part of SAMIL as it was demerged in 2021 and later listed as Motherson Sumi Wiring India (MSWIL). At the same time, the name of Motherson Sumi Systems was changed to Samvardhana Motherson International.

As for the present holding structure, SAMIL owns a 33.4% stake in MSWIL. Its other businesses come under its wholly-owned subsidiary Samvardhana Motherson Automotive Systems Group BV (SMRP BV).

The company’s return ratios: RoCE and RoE took a hit in FY22 on account of lower profitability because of higher tax expenses. Presently, the stock trades at a price-to-earnings ratio of 45.7 and a price-to-book value ratio of 2.25.

As for the long-term prospects of Samvardhana Motherson, the management has targeted revenues of $ 36 billion by FY 2024-25 with a high RoCE of 40% as part of its ‘Vision 2025’ plan.

Best Mid Cap Stocks Under Rs 100 #2 – NHPC

best mid cap stocks under Rs 100 - NHPC Logo
CMP ₹43 Market Cap (Cr.) ₹43,500
EPS ₹3.7 Stock P/E 11.8
RoCE 6.5% RoE 10.4%
Promoter Holding 71% Book Value ₹37
Debt to Equity 0.70 Price to Book Value 1.18
Net Profit Margin 41.2% Operating Profit Margin 43.7%

Founded in 1975, NHPC Ltd. is India’s largest hydropower development company in India. It is a Mini-Ratna status CPSU under the Ministry of Power, Government of India. NHPC is an end-to-end developer of hydro projects having capabilities to execute all tasks from conceptualization to commissioning of the projects. 

The sale of energy from its various power stations forms the income of NHPC. At the end of FY22, the installed power generation capacity of the government company stood at 7071.2 MW.  In recent years, the company has also been involved in the establishment of wind and solar power projects.

The image below depicts the widespread geographical presence of the power stations of NHPC.

NHPC Power Stations
Source: NHPC Ltd. Annual Report FY 2021-22

Talking about the recent developments, the Nepal government has provided NHPC with the license to conduct a preliminary study for the 450 MW Seti River-6 Hydropower Project. Last year, it approved two survey permits for 750 MW West Seti and 450 MW Seti River 6 hydropower projects.

In addition to this, the company has announced that it will re-start the development of the 2,000 MW Subansiri Lower Hydroelectric Project which was put on hold because of safety concerns.

For a utility company, NHPC has an adequate debt-to-equity ratio of 0.70. It is a dividend stock with a dividend yield of 4.17% at the present PE ratio of 11.8.

Also Read – Best Mid Cap Stocks Under Rs 200 – Complete Stock List & Analysis

Best Mid Cap Stocks Under Rs 100 #3 – IDFC First Bank

IDFC logo
CMP ₹64 Market Cap (Cr.) ₹42,350
EPS ₹3.75 Stock P/E 17
RoA 1.13% RoE 10.95%
Promoter Holding 40% Book Value ₹34
Credit Cost 1.16% Price to Book Value 1.88
GNPA 2.51% NNPA 0.86%

IDFC First Bank was formed in December 2018 after the merger of erstwhile Capital First and erstwhile IDFC Bank. As of the present date, IDFC First Bank is one of the leading private sector banks in India with a diversified loan portfolio of more than 20 business lines. 

It provides a broad range of banking products and services such as personal loans, mortgage loans, car loans, credit cards, education loans, and working capital & debt financing to retail, SME, and corporate customers.

The bank has built a solid brand in a short period of time because of targeted marketing, mobile application, and various partnerships. Presently, it has more than 7.3 million customers.

For the financial year ending March 2023, the customer deposits of IDFC First Bank grew by a whopping 47% year on year to Rs 1,36,812 crore. Its CASA ratio stood at 49.8%. The asset quality improved with GNPA and NNPA coming down to 2.96% and 1.03% respectively.  The bank reported a robust capital adequacy ratio of 16.82%.

The bank has continued its stellar performance since the merger. Its net profit grew to Rs 2,437 crore in FY23 from only Rs 145 crore in FY22.

Best Mid Cap Stocks Under Rs 100 #4 – Steel Authority of India

best mid cap stocks under Rs 100 - sail logo
CMP ₹82 Market Cap (Cr.) ₹34,000
EPS ₹8.5 Stock P/E 10.4
RoCE 24% RoE 25.2%
Promoter Holding 65% Book Value ₹131
Debt to Equity 0.58 Price to Book Value 0.63
Net Profit Margin 12% Operating Profit Margin 20.6%

Established in January 1973, SAIL is one of the biggest steel manufacturers in India. It comes under the aegis of the Ministry of Steel, Government of India which holds a majority 65% promoter stake in the company.  

SAIL is structured as a holding company owning multiple steel companies across India. Presently, it has five integrated production plants for steel and iron. In addition to this, the giant also has three special steel facilities and captive mines of iron ore, flux, and coal.

Talking about the product portfolio of the steel PSU, it manufactures hot & cold rolled products, galvanized products, railway products, structurals, wire rods, plates, TMT bars, pipes, and more.

The recent boom in steel prices and cut in Chinese steel production aided SAIL to post its best production figures in FY23 with 18.28 million tonnes (MT) of crude steel. It has plans to increase its crude steel production capacity to 34-35 million tonnes by 2031 from 19.5 million tonnes at present.

The company reported a net profit of Rs 12,243 crore for the financial year 2021-22 on revenues of Rs 103,477 crore. It is a dividend stock with a high dividend yield of 10.7% and presently trades at a price-to-earnings ratio of 10.4. 

Best Mid Cap Stocks Under Rs 100 #5 – Bharat Heavy Electricals 

BHEL logo
CMP ₹73 Market Cap (Cr.) ₹25,250
EPS ₹2.2 Stock P/E 32.5
RoCE 2.9% RoE 1.7%
Promoter Holding 63% Book Value 75.4
Debt to Equity 0.22 Price to Book Value 0.96
Net Profit Margin 2% Operating Profit Margin 4%

Founded almost 7 decades ago, Bharat Heavy Electricals Ltd. (BHEL) is a central public sector undertaking under the Ministry of Heavy Industries, Government of India. It is engaged in the design, manufacturing, and supply of various equipment for a broad range of industries including power generation, transmission, defense, aerospace, transportation, etc.

It employs more than 30,000 people across its 16 manufacturing facilities, 4 regional offices, 8 service centers, and 15 regional marketing centers. 

BHEL is a preferred choice for various projects and contracts in all modes: EPC, Supply, Supply & Supervision, Consortium partner, Contract Manufacturer, etc.

The capital goods company produces products such as compressors, transformers, shunt reactors, motors, pumps, heat exchangers, valves, and oil-field equipment that go into the installation of the power plants. In addition to this, it has also built locomotives for Indian railways and drilling rigs for oil companies.

The CPSU turned profitable in FY22 after reporting losses in FY21 and FY20. After the quarter ending December 2022, its trailing twelve-month net profits stood at Rs 779 crore on sales of Rs 23,200 crore.

The stock of BHEL trades at a PE ratio of 32.5 highlighting the confidence of the investors in the future growth prospects of the government company.

Quick Read – Best Mid Cap Stocks Under Rs 50 – Analysis and Complete List

List of All Mid Cap Stocks Under Rs 100

The table below puts together the names of the stocks we covered above along with a few others.

Sl No Company Industry MCap(Cr) Current Price (Rs) PE Ratio TTM
1 Indian Overseas Bank Bank - Public ₹47,993.22 ₹25.39 28.08
2 Yes Bank Ltd. Bank - Private ₹46,180.60 ₹16.06 62.76
3 NHPC Ltd. Power Generation, Distribution ₹45,423.65 ₹45.22 11.82
4 Indian Railway Finance Corporation Ltd. Finance Term Lending ₹44,785.77 ₹34.27 6.89
5 IDFC First Bank Ltd. Bank - Private ₹42,216.91 ₹63.78 16.99
6 Bank Of India Bank - Public ₹35,430.19 ₹86.34 11.38
7 Steel Authority Of India Ltd. Steel & Iron Products ₹35,377.95 ₹85.65 10.12
8 UCO Bank Bank - Public ₹34,755.97 ₹29.07 19.03
9 Vodafone Idea Ltd. Telecommunication - Service Provider ₹34,124.46 ₹7.01 0.00
10 Bharat Heavy Electricals Ltd. Engineering - Industrial Equipments ₹29,949.23 ₹86.01 38.45
11 GMR Airports Infrastructure Ltd. Engineering - Construction ₹28,012.82 ₹46.41 231.64
12 Central Bank Of India Bank - Public ₹25,027.15 ₹28.83 14.91
13 L&T Finance Holdings Ltd. Finance - NBFC ₹23,777.95 ₹95.88 14.65
14 Punjab & Sind Bank Bank - Public ₹23,769.70 ₹35.07 18.10
15 Motherson Sumi Wiring India Ltd. Steel & Iron Products ₹23,330.19 ₹52.77 59.07
16 Bank Of Maharashtra Bank - Public ₹20,137.65 ₹29.92 7.73
17 IRB Infrastructure Developers Ltd. Engineering - Construction ₹17,193.03 ₹28.53 22.54

In Conclusion

A common theme that has emerged from our study of the best mid cap stocks under Rs 100 is that they have either come out of the recovery or have growth plans in place. This helps to win the belief of the investors as the companies have a greater likelihood of higher profits in the coming quarters. 

What are your favorite mid cap stocks? And why do you like them? How about you tell us about your favorite mid-cap picks in the comments below?

Stay updated on the latest Stock Market News and Corporate Actions NSE with Trade Brains Portal, while also keeping an eye on the Top Gainers Today in NSE with our Stock Heatmap feature

The post Best Mid Cap Stocks Under Rs 100 – Complete List & Fundamentals appeared first on Trade Brains.

Via

https://ift.tt/I0Em9qX

Wednesday, May 3, 2023

Nexus Select Trust REIT IPO Review – Strengths & Weaknesses

Nexus Select Trust REIT - Cover Image

Nexus select trust REIT IPO Review: Nexus select trust REIT is coming up with its Initial Public Offering. The IPO will open for subscription on May 9, 2023, and close on May 11, 2023. The company is looking to raise  Rs 3,200 Crores through the IPO out of which Rs 1,400 Crore will be a new issue and the remaining Rs 1,800 Crore will be an offer for sale.

In this article, we take a closer look at the Nexus select trust REIT IPO Review and its possible future prospects. Keep Reading to find out!

About the company

Nexus Select Trust is sponsored by global investment giant Blackstone. This would be the fourth REIT to make its debut on the Indian stock markets and the first in the retail space since the other three listed REITs are in the residential sector. Nexus Select Trust has a portfolio of 17 operational shopping centers throughout 14 major cities, totaling 9.8 million square feet, with 96% of its properties under lease and a diverse tenant base of 983 domestic and international brands with 2,924. Shopping centers are located in major cities of India such as Delhi, Navi Mumbai, Bengaluru, Pune, Hyderabad, and Chennai. 

Company Having a diverse tenant mix in industries such as fashion & accessories, hypermarket, entertainment, and food and drinks which accounted for 30% of India’s total discretionary retail spending in FY20 and had a population CAGR that was 226 basis points higher than the national average from 2011 to 2021.

Financial Highlights

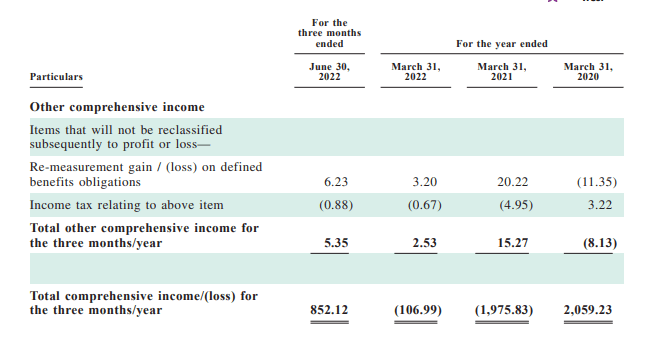
According to Nexus Select Trust’s financials, their assets have decreased from Rs.9,527.63 crore in March 2020 to Rs. 9,052.07 crore in March 2022.

Their revenue from operations has also decreased, from Rs. 1,621.97 crore in March 2020 to Rs. 1,318.21 crore in March 2022. Further, its earnings turned negative as it reported a loss of Rs 10.95 Crore against a profit of Rs 2,06.7 Crore in March 2020.

It is also notable that the company’s borrowing has risen from Rs. 5,955.67 crores in March 2020 to Rs. 6,311.20 crores on March 22.

The company is well-positioned for substantial organic growth as a result of contractual rent increases, increasing tenant sales, higher Turnover Rentals, and re-leasing at higher market rates. Between FY23 and FY25, their Portfolio’s total NOI is expected to expand organically by 26.8%, up from 15.9%.

The balance sheet of the company

Nexus Select Trust REIT IPO Review - Balance sheet
Nexus Select Trust REIT IPO Review - Balance Sheet

(Source: DRHP of the company)

Profit & Loss statement

Profit and Loss statement
Profit and Loss of the company

(Source: DRHP of company)

Competitors of the company

As per the DRHP of the company, there are no direct competitors of the company. However, there are three other REITs listed in the Indian stock exchanges- Embassy Office Parks REIT, Mindspace Business Parks REIT, and Brookfield India Real Estate Trust.

Strengths of the company

  • The company has Leased 3.5 msf, added 332 new brands to the tenant base, and achieved average Re-leasing Spreads of 19.5% on approximately 2.2 msf of re-leased space.
  • The company’s pan-India presence helped drive portfolio-level leasing synergies, developing close connections with tenants, and attracting and retaining high-quality tenants.
  • Highly occupied by a diversified tenant base of renowned national and international brands.
  • The shopping centers are carefully positioned in ideal in-fill locations with strong entry barriers.
  • Has a highly stabilized portfolio with committed occupancy of 93.5%. 
  • Through industry-leading technology initiatives, the company has proprietary insights and access.
  • The company has increased leased retail spaces from 3.5 msf to 5.0 msf through strategic acquisitions and accretive build-outs of urban consumption centers.
  • The company’s tenant leases provide for Minimum Guaranteed Rentals with built-in contractual rent escalations of 12% to 15% over a period of three to five years. 
  • Strong organic growth is estimated to contribute 87.0% of the projected rise in NOI over the Projections Period. In addition, they have a proven track record of generating inorganic growth through accretive acquisitions of stable assets and turnaround of underperforming businesses.

Weakness of the Company

  • The company is subject to extensive government regulations that are prone to change. Any failure to comply with these regulations or the regulatory agencies can negatively affect the business.
  • The company may face a variety of risks and uncertainties relating to public health emergencies, including the continuing worldwide COVID-19 outbreak. The future impact of COVID-19 is uncertain and hard to measure.
  • Increased online purchasing and decreased footfalls may result in lower tenancy demand for company property.
  • The leasing of space assets drives a significant portion of revenue.
  • Changes in local development regulations may have an impact on business.
  • Tenant leases across our Portfolio are susceptible to non-renewal, non-replacement, default, early termination, regulatory or legal procedures, or changes in relevant laws or regulations, which can have an impact on leasing and other income..
  • Low occupancy and rent levels may hurt the business
  • The top ten customers account for 21.6% of the gross rentals and 35.9% of its occupied area
  • If the Indian real estate market weakens, it adversely affects operating performance and cash flow results.

Key IPO Information

Promotors: Arjun Sharma, Dalip Sehgal, Tuhin Parikh, Michael Holland and Jayesh Merchant, Sadashiv Rao.

Book Running Lead Manager:

  • 1. BOFA Securities India Limited
  • 2. Axis Capital Limited 
  • 3. Citigroup Global Markets India Private Limited 
  • 4. HSBC Securities & Capital Markets Pvt Ltd 
  • 5. IIFL Securities Ltd 
  • 6. JM Financial Limited 
  • 7. J.P. Morgan India Private Limited 
  • 8. Kotak Mahindra Capital Company Limited 
  • 9. Morgan Stanley India Company Pvt Ltd
  • 10. SBI Capital Markets Limited
Particulars Details
IPO Size ₹3200 cr
Fresh issue ₹1400 cr
Offer for sale ₹ 1800 cr
Opening date May 9,2023
Closing date May 11,2023
Face value -
Price brand ₹95 to ₹100 per share
Lot size -
Minimum lot size 150 ( ₹15,000)
Maximum lot size -
Listing date May 19, 2023(Likely to be)

The Objective of the Issue

  • Acquisition of holdings in certain asset SPVs and redemption of debt securities.
  • Repayment and redemption of some financial debts of asset SPVs and investment entities, as well as for general purposes.

In Closing

In this article, we looked at the details of Nexus select trust REIT IPO Review 2023. Analysts remain divided on the IPO and its potential gains. This is a good opportunity for investors to look into the company and analyze its strengths and weaknesses. That’s it for this post

Stay updated on the latest Stock Market News and Corporate Actions NSE with Trade Brains Portal, while also keeping an eye on the Top Gainers Today in NSE with our Stock Heatmap feature

The post Nexus Select Trust REIT IPO Review – Strengths & Weaknesses appeared first on Trade Brains.

Via

https://ift.tt/BHwLTCl

Tuesday, May 2, 2023

Best Mid Cap Stocks Under Rs 200 – Complete Stock List & Analysis

Best Mid Cap Stocks Under Rs 200 - Cover Image

Best Mid Cap Stocks Under Rs 200: According to a recent classification announced by the Association of Mutual Funds in India (AMFI) at the start of 2023, stocks that have a market capitalization between 16,800 – 48,900 crores come under the ‘Mid-Cap’ category. As a result of this, there are presently 150-odd companies in the country coming under the same class of stocks.

In the past few years, it has been observed that the Mid-Cap stocks outperformed both, i.e., the large-cap and small-cap stocks. Due to such an advantageous position enjoyed in the stock market, they have become a favorite of seasoned investors. Such types of stocks can exploit the best of both ends, which is risk moderation and substantial returns.

Some of the features of Mid-Cap stocks include diversification of stocks, more liquid compared to small-cap stocks, and high chances of growth leading to enhancements of profitability.

Best mid cap stocks under Rs 200

Herein this article, we will race through the best Mid-cap stocks in India under Rs 200. The primary factor for the selection of stocks has been the market capitalization of the companies. Let’s have a look at them one by one.

Best mid cap stocks under Rs 200 #1 – Power Finance Corporation Limited

Best mid cap stocks under Rs 200 - PFC logo
CMP ₹157 Market Cap (Cr.) ₹41,436
EPS ₹54.6 Stock P/E 2.88
RoCE 9.39% RoE 28.38%
Promoter Holding 55.99% Book Value ₹290
RoA 2.40% Price to Book Value 0.55
Net Profit Margin 24.60% Operating Profit Margin 91%

Power Finance Corporation Limited is a financial institution operating in the country that is dedicated to the power sector and various projects that come under the same. The product portfolio of the company includes short-term loans, line of credit facilities, etc.

The company strives hard to explore new areas for sustainable growth such as providing funding to nuclear power projects, renewable equipment manufacturers, etc. The company has a market capitalization of Rs 41,436 crores.

The revenues and PAT figures of the company reported decent growth with revenues shifting from Rs 71,709 crores in FY20-21 to Rs 76,661 crores during FY21-22 and PAT, after declining during the covid year, bounced back and standing at Rs 18,791 crores in FY21-22.

The profitability metrics, on a contrasting note, have slightly moved down with return on equity (ROE) shifting from 28.52 percent in FY20-21 to 28.38 percent during FY21-22. The return on capital employed (ROCE), during the same period, went down from 9.46 percent to 9.39 percent.

Best mid cap stocks under Rs 200 #2- Aditya Birla Capital Limited

Best mid cap stocks under Rs 200 - Aditya Birla Logo
CMP ₹158 Market Cap (Cr.) ₹38,305
EPS ₹19.2 Stock P/E 8.28
RoCE 8.24% RoE 11.50%
Promoter Holding 71.02% Book Value ₹67.7
RoA 1.25% Price to Book Value 2.33
Net Profit Margin 7.47% Operating Profit Margin 25.40%

Based in Mumbai, Aditya Birla Capital (ABCL) is a wealth management firm with a strong presence across various lines of business such as asset management, corporate lending, private equity, currency, commodity broking, etc.

The company is committed to the main objective of serving end-to-end financial services and fulfilling the needs of its retail as well as corporate customers. The company has a market capitalization of Rs 38,305 crores.

The consistent increase in the revenues and net profit figures contribute to showcasing a healthy picture of the company supported by efficient cost management. As mentioned, revenues shifted from Rs 19,554 crores in FY20-21 to Rs 22,608 crores in FY21-22, and net profits, during the same period, showed a movement from Rs 1,106 crores to Rs 1,660 crores.

The return on equity (ROE) and return on capital employed (ROCE) reported decent improvements with the first one increasing from 8.52 percent in FY20-21 to 11.50 percent during FY21-22 and the latter, during the same period, showed a slight movement from 8.12 percent to 8.24 percent.

Also Read – Best Small Cap Stocks Under Rs 500 – Key Metrics & Complete List

Best mid cap stocks under Rs 200 #3 – NMDC Limited

NMDC Logo
CMP ₹110 Market Cap (Cr.) ₹32,193
EPS ₹17.3 Stock P/E 6.35
RoCE 37% RoE 28.96%
Promoter Holding 60.79% Book Value ₹69.1
RoA 23.00% Price to Book Value 1.59
Net Profit Margin 36.30% Operating Profit Margin 35.50%

NMDC Ltd is engaged in the business of mining a wide range of minerals, including copper, iron ore, rock phosphate, etc. The majority of its revenue comes from the ‘Iron Ore segment. Geographically, the company generates the majority of its revenue from the Indian domestic market. The company has a market capitalization of Rs 32,193 crores.

The Company produces around 35 Metric Tonnes Per Annum (MTPA) of iron ore from its major iron-producing units which are the ‘Bailadila’ Sector in Chhattisgarh and ‘Donimalai’ in Bellary-Hospet region in the state of Karnataka. It aims to have an iron ore production capacity of 100 MT by FY30.

Digging into the financials of the company, the revenues increased from Rs 15,370 crores in FY20-21 to Rs 25,882 crores in FY21-22. Likewise, the net profit figures of the company have gone up from Rs 6,247 crores during FY20-21 and jumped to Rs 9,392 crores in FY21-22.

The profitability metrics such as the ROE and ROCE reported decent improvements with ROE increasing from 21.71 percent in FY20-21 to 28.96 percent during FY21-22 and ROCE, during the same period, showing movement from 29.65 percent to 37 percent. Though within the ideal range, the debt-to-equity ratio of the company increased from 0.07 in FY20-21 to 0.1 during FY21-22.

Best mid cap stocks under Rs 200 #4 – Rural Electrification Corporation Limited

REC logo
CMP ₹122 Market Cap (Cr.) ₹32,165
EPS ₹39.5 Stock P/E 3.08
RoCE 9.10% RoE 21.39%
Promoter Holding 52.63% Book Value ₹210
RoA 2.47% Price to Book Value 0.59
Net Profit Margin 25.50% Operating Profit Margin 91.10%

Rural Electrification Corporation Limited (REC) is a government agency established in 1969. The agency was formed with the main objective to finance as well as promote the ‘Power Sector’ projects all over the nation.

The company is also engaged in providing loan assistance to central & state Power Sector Utilities, Private Sector Project Developers, etc. REC has a market capitalization of Rs 32,165 crores.

The financials portray a strong track record of robust growth in the company with revenues moving from Rs 35,553 crores in FY20-21 to Rs 39,282 crores in FY21-22. Moreover, the after-tax profits grew from Rs 8,380 crores in FY20-21 to Rs 10,048 crores in FY21-22.

The profitability metrics too have shown a growth in numbers. Return on equity (ROE) shifted from 21.32 percent in FY20-21 to 21.39 percent in FY21-22. Return on capital employed (ROCE), during the same period, showed a contrasting movement with a slight fall in numbers from 9.29 percent to 9.1 percent.

The debt-to-equity ratio of the company, though higher than what is desired, has witnessed a downfall for a couple of financial years with the most recent shift being from 7.53 in FY20-21 to 6.49 during FY21-22.

Best mid cap stocks under Rs 200 #5 – Federal Bank Limited

Fedaral Bank Logo
CMP ₹131 Market Cap (Cr.) ₹27,747
EPS ₹13.3 Stock P/E 9.92
RoCE 9.68% RoE 11.00%
Book Value ₹91.6 CASA Ratio 37.12%
GNPA 2.80% NNPA 0.96%
Promoter Holding 0.00% Capital Adequacy 15.77%

Federal Bank Ltd is an India-based commercial banking company operating through a network of branches and ATMs across the country. Business segments of the company consist of the corporate/wholesale banking segment, treasury segment, retail banking segment, and other banking operations containing para-banking activities and other banking transactions.

It generates a majority of revenue from the domestic markets. The company has a market capitalization of Rs 27,747 crores.

As of the quarter ending December 2022, the Bank has an aggregate of 1,272 Branches and 1,957 ATM/Recyclers. Moreover, the Bank has 1,10,00,000 plus customers using its services.

Going through the financials of the company, increasing net profit numbers are reported with a shift from Rs 1,647 crores in FY20-21 to Rs 1,965 crores in FY21-22.

Evaluating some metrics specific to the Banking industry, the gross, as well as net NPA ratios, have reduced with the first one shifting down from 3.41 in FY20-21 to 2.8 during FY21-22 and the latter, during the same period, going down from 1.19 to 0.96.

Profitability metrics such as the ROE and ROCE moved in opposing directions with ROE showing upward movements, the recent one being from 10.52 percent during FY20-21 to 11 percent. On a contrasting note, the ROCE numbers went down from 10.12 percent to 9.68 percent keeping the timeframe the same.

List Of All Mid cap Stocks under Rs 200

Sl No Company Industry MCap(Cr) Current Price (Rs) PE Ratio TTM
1 Indian Overseas Bank Bank - Public ₹48,787.13 ₹25.81 28.54
2 Yes Bank Ltd. Bank - Private ₹45,087.90 ₹15.68 61.28
3 Power Finance Corporation Ltd. Finance Term Lending ₹44,854.98 ₹169.90 3.11
4 NHPC Ltd. Power Generation, Distribution ₹44,479.41 ₹44.28 11.57
5 Ashok Leyland Ltd. Automobiles-Trucks,Lcv ₹42,852.78 ₹145.95 68.18
6 Indus Towers Ltd. Telecommunication - Service Provider ₹41,717.62 ₹154.80 20.45
7 Indian Railway Finance Corporation Ltd. Finance Term Lending ₹41,557.85 ₹31.80 6.39
8 IDFC First Bank Ltd. Bank - Private ₹40,754.07 ₹61.57 16.40
9 Aditya Birla Capital Ltd. Finance - NBFC ₹40,409.15 ₹167.10 8.71
10 UCO Bank Bank - Public ₹35,987.43 ₹30.10 22.73
11 FSN E-Commerce Ventures Ltd. e-Commerce ₹35,013.78 ₹122.75 0.00
12 REC Ltd. Finance Term Lending ₹34,811.22 ₹132.20 3.35
13 Bank Of India Bank - Public ₹34,494.58 ₹84.06 11.08
14 Steel Authority Of India Ltd. Steel & Iron Products ₹34,180.10 ₹82.75 9.78
15 Vodafone Idea Ltd. Telecommunication - Service Provider ₹33,832.38 ₹6.95 0.00
16 NMDC Ltd. Mining & Minerals ₹31,826.38 ₹108.60 6.19
17 The Federal Bank Ltd. Bank - Private ₹28,563.43 ₹134.95 10.21
18 GMR Airports Infrastructure Ltd. Engineering - Construction ₹27,529.95 ₹45.61 227.65
19 Bharat Heavy Electricals Ltd. Engineering - Industrial Equipments ₹27,285.45 ₹78.36 35.03
20 General Insurance Corporation of India Insurance ₹26,903.72 ₹153.75 4.41
21 Central Bank Of India Bank - Public ₹26,346.65 ₹30.35 15.69
22 Punjab & Sind Bank Bank - Public ₹24,379.70 ₹35.97 20.28
23 Motherson Sumi Wiring India Ltd. Steel & Iron Products ₹23,705.98 ₹53.62 60.02
24 L&T Finance Holdings Ltd. Finance - NBFC ₹22,934.76 ₹92.48 14.13
25 Rail Vikas Nigam Ltd. Engineering - Construction ₹22,443.16 ₹107.64 15.59
26 Bank Of Maharashtra Bank - Public ₹20,332.83 ₹30.21 7.81
27 Devyani International Ltd. Consumer Food ₹19,449.92 ₹161.35 69.30
28 Zee Entertainment Enterprises Ltd. TV Broadcasting & Software Production ₹18,907.82 ₹196.85 44.41
29 The New India Assurance Company Ltd. Insurance ₹17,419.36 ₹105.70 47.15

In Closing

In this article, we went through the best Mid-cap stocks in India under Rs 200, their key operational metrics, and got a gist of how the companies have performed. I hope this article helped you unlock some key points and gain knowledge of the stocks that would help you in your investing journey. Happy Investing!

Will this bullish behavior of the Mid-cap stocks continue in the future? Let’s discuss your take on the same in the comments section below.

Stay updated on the latest Stock Market News and Corporate Actions NSE with Trade Brains Portal, while also keeping an eye on the Top Gainers Today in NSE with our Stock Heatmap feature

The post Best Mid Cap Stocks Under Rs 200 – Complete Stock List & Analysis appeared first on Trade Brains.

Via

https://ift.tt/BHwLTCl

Monday, May 1, 2023

Fundamental Analysis of IRCTC – Future Plans, Financials & More

Fundamental Analysis of IRCTC - Cover Image

Fundamental Analysis of IRCTC: Indian Railway Catering & Tourism Corporation (IRCTC) stock had one of the best IPO listing debuts on Dalal Street closing at a premium of 127% over the issue price. It rallied a further 600% to touch Rs 1,100 levels in October of 2021.

However, it has fallen 45% since then begging the question, “Should I buy the dip?” We’ll attempt to answer this and other questions in this article by performing a fundamental analysis of IRCTC.

Fundamental Analysis of IRCTC

We’ll start our study by briefly getting ourselves acquainted with the company. After that, we’ll read in-depth about its businesses performing a segment analysis. Next, we’ll race through the industry overview and financials of the stock. A highlight of the future plans and a summary to conclude the article at the end.

Company Overview

Indian Railway Catering & Tourism Corporation (IRCTC) Ltd. has incorporated 24 years ago in 1999 as a government company under the Indan Railways to facilitate catering & hospitality services.

Over the years, it has become a prominent enterprise in the Indian railways industry offering various services to rail customers. It is engaged in providing catering, packaged drinking water, internet ticketing, and travel & tourism services.

The company had its IPO in September 2019 with the government of India selling its stake partially. Over the next quarters, it further reduced its shareholding bringing it to 62.4% as per the recent shareholding data for the quarter ending December 2022.

The ticketing company employs over 1970 people. Its overall traffic for e-ticketing applications (website and mobile combined) stood at 2289.66 million with 75.22 million app downloads as per the data from its FY22 annual report.

IRCTC is a monopoly stock as it has exclusive rights to sell rail tickets online. In addition to this, it also has a monopoly in the catering business as no other entity has the authorization to sell food and beverages on the train. 

As a feather on its cap, IRCTC processed a whopping 80.43% of the total railway tickets booked in FY22. The balance was purchased via ticket counters at the railway stations.

We have a good understanding of the company in the study now. Let us learn more about its businesses in the next section on segment analysis.

Segment Analysis

IRCTC organizes its businesses across five segments:

  1. Internet ticketing: This is the largest division of IRCTC in terms of revenues and profits. It provides online booking services for train tickets through its mobile app and website. 
  2. Catering: This segment houses food and hospitality services including onboard food & water catering through pantry cars in trains, food plazas & waiting rooms at railway stations, and fees charged from partner restaurants for e-catering.
  3. Tourism & train operations: Covers travel & trip packages, booking of hotels, flights, buses, etc., and operations of premium trains such as Maharaja Express and Golden Chariot. 
  4. Railneer: This segment runs 15 manufacturing plants across India for the packaged drinking water sold under the ‘Railneer’ brand at railway stations and in trains.
  5. State Teertha: This service allows people to book pilgrimage trains across states.

The table below shows the share of different revenue segments of IRCTC over the last five years.

Segment-wise Revenue Contr. 2018 2019 2020 2021 2022
Catering 49 55 46 29 27
Railneer 11 9 10 7 9
Internet Ticketing 14 12 27 57 54
Tourism & Train Operations 12 13 13 7 8
State Teertha 14 10 4 0 2
(figures in %)

The table below presents the segment-wise profit before tax (and exceptional items) of IRCTC.

Segment-wise PBT 2018 2019 2020 2021 2022
Catering 123 127 119 -92 20
Railneer 37 29 52 -7 10
Internet Ticketing 104 156 495 323 857
Tourism & Train Operations -12 23 10 -74 -48
State Teertha 50 49 15 0 3
(figures in Rs Cr)

We can conclude from our segment analysis that IRCTC’s stock has undergone a significant change in the business during the study period. In the next section on industry overview, let us learn about the railways’ sector and e-ticketing prospects in India.

Industry Overview

Managed by the Government of India, the Indian Railways network is the fourth largest globally. The growth of railway companies closely tracks the progress of the railway infrastructure in the nation. 

In the Union Budget 2023-24, honorable Finance Minister Nirmala Sitharaman allocated Rs 2.4 lakh crore, the highest ever so far towards the development, degradation, and modernization of Indian railways. The gross capital outlay was Rs 1.37 lakh crore in FY 2022-23.

But that’s not it. A few other factors also are expected to drive the growth of e-ticketing, catering, and hospitality services in Indian railways. These are the core areas in which IRCTC operates. 

Going forward, rising disposable income, higher penetration of the internet, changing consumer preferences, and demand for convenience are supposed to boost the growth of online ticket reservations and hospitality services in railways. 

IRCTC – Financials

Revenue and Net Profit Growth

At first glance, it seems that the operating revenues of IRCTC grew at a slow pace of 5.03% from Rs 1,470 crore in FY18 to Rs 1,879 crore in FY22. 

However, following our segment analysis above we can note that during the period, the company saw a shift in business from being a catering company to becoming an internet ticketing company. 

This is reflected in the sharp growth of operating profit and net profit which grew at a CAGR of 21.49% and 24.64% to Rs 954 crore and Rs 664 crore in FY22.

The table below presents the growth of revenues, operating profit, and net profit of IRCTC over the last five years.

Fiscal Year Operating Revenue Operating Profit Net Profit
2022 1,879 954 664
2021 777 273 187
2020 2,275 778 529
2019 1,870 472 309
2018 1,470 360 221
5-yr CAGR 5.03% 21.52% 24.64%
(figures in Rs Cr except for CAGR)

Operating and Net Profit Margins

Taking forward our fundamental analysis of IRCTC to study margins, the change of business aided the stock to post higher profit margins in recent years.

The operating profit margin doubled and the net profit margin more than doubled in the last five years as the share of the internet ticketing division increased. This transformed IRCTC into a technology-focused enterprise with higher profit margins than the traditional catering business.

The table below highlights the growth in operating profit margins and net profit margins of IRCTC over the last five fiscals.

Fiscal Year Operating Profit Margin Net Profit Margin
2022 50.7% 35.3%
2021 35.1% 24.1%
2020 34.2% 23.2%
2019 25.2% 16.5%
2018 24.5% 15.0%
(figures in %)

In the next section, let us see how the change in segment profits has impacted profitability and efficiency by analyzing the return ratios: return on capital employed (RoCE) and return on equity (RoE) of IRCTC.

Return Ratios: RoCE and RoE

The return ratios of IRCTC have increased in the previous five financial years because of higher profitability and a reduction in capital deployed as the earnings share of the capital-light internet ticketing division increased.

The RoCE and RoE were down to 47% and 40% in FY22 respectively from their highs in FY20 on account of the impact of Covid-19 on travel.

The table below highlights the return ratios: RoCE and RoE of IRCTC over the past few years.

Fiscal Year RoCE RoE
2022 47 40
2021 18 14
2020 56 40
2019 45 29
2018 36 23
(figures in %)

Debt/Equity and Interest Coverage

We’ll keep the debt analysis of IRCTC short as it is largely a debt-free stock with a debt-to-equity ratio of 0.06 and a high-interest coverage ratio of 27.8. 

Future Plans of IRCTC

So far we looked at the previous fiscals data for our fundamental analysis of IRCTC. In this section, we’ll try to get a sense of the future plans of the company.

  1. The catering division is gradually pivoting from a product business to a service business further strengthening IRCTC’s position as a tech player. Previously, only IRCTC food was served on trains. Now, the e-catering feature allows customers to order from partner restaurants charging a fee for the transaction. This provides the customers with menu diversity and greater choices.
  2. The share of Railneer in the profits of FY22 was comparatively lower as the division worked at only 42% capacity utilization because of lesser travel (impact of Covid-19 led pandemic). The segment is expected to perform better in the quarters ahead with higher utilization and increased consumption of packaged drinking water.
  3. In addition to the 15 plants for drinking water bottles at present, four more production facilities are under construction.
  4. Recently, the management notified that the company is planning to build and operate budget hotels across the country. For this first-of-a-kind initiative, it has estimated an investment of Rs 500 crore for the first phase.
Fundamental Analysis of IRCTC - Annual Report
Source: IRCTC Ltd. Annual Report FY22

Key Metrics Of IRCTC

We are almost at the end of our fundamental analysis of IRCTC. The table below presents the key metrics of the railway stock.

CMP ₹607 Market Cap (Cr.) ₹48,500
EPS ₹11.8 Stock P/E 52
RoCE 47% RoE 40%
Promoter Holding 62% Book Value ₹28
Debt to Equity 0.06 Price to Book Value 22
Net Profit Margin 35% Operating Profit Margin 51%

In Conclusion

As we arrive at the end of our fundamental analysis of IRCTC, we can definitely say that the business has ample room for growth in the next few quarters as travel resumes and its different businesses start working at higher capacity utilization. However, the concern is the high P/E of 52 which gives the impression that much of this growth has already been captured in the stock price.

Thus, do you think IRCTC at present valuations is an undervalued stock? What can be growth opportunities for the company? How about you enlighten us with your input in the comments below?

Stay updated on the latest Stock Market News and Corporate Actions NSE with Trade Brains Portal, while also keeping an eye on the Top Gainers Today in NSE with our Stock Heatmap feature.

The post Fundamental Analysis of IRCTC – Future Plans, Financials & More appeared first on Trade Brains.

Via

https://ift.tt/2dYeo1J